
Resume
The principal objective of this master thesis is to estimate the fair price of one Pandora share as of 31 December 2011 on a stand-alone basis. Valuation is conducted through strategic and financial assessment.
Investors were excited to participate in the Denmark’s largest initial public offering in sixteen years and in a less than a year were “shocked” to find a sudden change in revenue and profit trend. The reaction was extraordinary – share price lost two thirds in just one day. This master thesis tries to estimate whether market priced Pandora’s stock objectively or it was just a temporary overreaction.
Pandora became the third largest world jewelry company in a relatively short period. Company is atypical among largest jewelry players to operate without retail operations and focus on manufacturing. Pandora stands out to be a rare player to get such a wide acknowledgment by affordable jewelry consumers. Exceptional product charm is the primary value driver and the largest danger.
Strategic analysis shows that Pandora overcomes external environment and jewelry industry challenges with unique resources: successful product charm, state-of-the-art production facilities, inexpensive production team in Thailand, in-house designers from Denmark, revolving credit facility, highly valued brand; and core competences: extensive manufacturing experience, abilities to scale the craftsmanship, abilities to enter new markets, strong financial consolidation and control functions and win-win retail proposal.
Financial analysis reveals that Pandora reached the point when customers are not ready to pay for affordable jewelry more and should lower current prices to keep the volume stable. New markets and particularly emerging countries should remain being the most important contributors to growth, but there is a threat that the company will not be able to stabilize the revenues from mature markets. Pandora has superior profitability comparing with peers, but not sustainable in the long-term. Pandora’s ROIC is considerably higher than peers’, but has been gradually decreasing and approaching the industry average.
The fair price of 132 DKK per one share on 31 December 2011 is estimated with probability weighted scenario discounted cash flow value driver model. Valuation is also examined with alternative discounted cash flow models (economic profit, NOPLAT convergence, exit multiple, FCF perpetuity) and peer multiples. The outcome is tested with sensitivity analysis. Different scenarios are modeled to determine pessimistic (40 DKK) and optimistic (302 DKK) values.
The fair price is 144% higher than the market price of 54 DKK/share on 31 December 2011. The recommendation depends on the investment horizon. Investors are recommended to buy shares with long-term investment horizon and should hold shares or be aware of high volatilities in the short (from one to two years) period.
Table of Content
1. Introduction………………………………………………………………………………………………………………… 6
1.1. Problem statement…………………………………………………………………………………………………… 6
1.2. Methodology…………………………………………………………………………………………………………… 8
1.3. Thesis outline………………………………………………………………………………………………………….. 9
1.4. Benchmark……………………………………………………………………………………………………………. 10
1.5. Delimitations and data collection issues……………………………………………………………………… 10
2. Strategic analysis………………………………………………………………………………………………………. 11
2.1. Strategic position……………………………………………………………………………………………………. 11
2.1.1. External environment……………………………………………………………………………………….. 11
2.1.2. Strategic capabilities………………………………………………………………………………………….. 23
2.1.3. SWOT model…………………………………………………………………………………………………… 27
2.2. Strategic choices…………………………………………………………………………………………………….. 28
2.2.1. Business level directions…………………………………………………………………………………….. 28
2.2.2. Corporate level directions………………………………………………………………………………….. 29
2.2.3. Strategic modes………………………………………………………………………………………………… 31
3. Economic and financial analysis………………………………………………………………………………… 33
3.1. Income statement analysis……………………………………………………………………………………….. 33
3.1.1. Income statement reorganization………………………………………………………………………… 33
3.1.2. Revenue growth analysis……………………………………………………………………………………. 33
3.1.3. Profitability analysis…………………………………………………………………………………………. 35
3.2. Balance sheet analysis……………………………………………………………………………………………… 38
3.2.1. Balance sheet reorganization………………………………………………………………………………. 38
3.2.2. Invested capital analysis…………………………………………………………………………………….. 38
3.3. Cash flow statement analysis……………………………………………………………………………………. 41
3.3.1. Cash flow statement reorganization…………………………………………………………………….. 41
3.3.2. Decomposition of cash flows……………………………………………………………………………… 41
3.4. Combinative financial analysis………………………………………………………………………………….. 42
4. Forecast…………………………………………………………………………………………………………………….. 44
4.1. Forecast of revenues……………………………………………………………………………………………….. 44
4.2. Forecast of profitability…………………………………………………………………………………………… 49
4.3. Forecast of invested capital……………………………………………………………………………………… 52
4.4. Forecast of free cash flow………………………………………………………………………………………… 53
4.5. Forecast of the steady growth period…………………………………………………………………………. 54
5. Valuation………………………………………………………………………………………………………………….. 55
5.1. Weighted average cost of capital………………………………………………………………………………. 55
5.2. Discounted cash flow model……………………………………………………………………………………… 63
5.3. Economic profit model……………………………………………………………………………………………. 64
5.4. Cash flow model variations………………………………………………………………………………………. 65
5.5. Sensitivity analysis…………………………………………………………………………………………………. 65
5.6. Scenario matrix……………………………………………………………………………………………………… 67
5.7. Multiples………………………………………………………………………………………………………………. 69
5.8. Valuation summary…………………………………………………………………………………………………. 72
6. Conclusion………………………………………………………………………………………………………………… 74
7. Perspectives………………………………………………………………………………………………………………. 80
8. List of literature………………………………………………………………………………………………………… 81
9. Appendices………………………………………………………………………………………………………………… 89
1. Introduction
In a single day, 2 August 2011 Pandora lost about two thirds of its market value in Copenhagen stock exchange trading after cutting its annual forecast and announcement chief executive officer has left. Pandora has Denmark’s largest public stock sale in sixteen years and largest daily decline in market value of 12.5 bDKK. Company has a market value loss of 40.8 bDKK from the stock peaked in January 2011 to the end of 2011 (Wieneberg, 2011; Pandora, 2011a).

Pandora price – investorship.uk
“Credibility and visibility is now completely shot,” an analyst at Jefferies International, said in a note, adding he’s reviewing his “buy” recommendation on the stock. “Investors may regret ever opening this box of disappointments.” Revenue rose 3.6% to 1.39 bDKK and operating profit fell to 440 mDKK in 2Q 2011, missing the average estimate of respectively 1.73 bDKK and 611 mDKK in a Bloomberg survey of four analysts. On top of that, July sales plummeted about 30% (Wieneberg, 2011; Pandora, 2011a).
The results, published two weeks earlier than scheduled, are “totally unacceptable” and “self-inflicted,” chairman Allan Leighton said at a conference call with analysts. Pandora was wrong to have increased prices, he added. “We have been doing that at a time when consumers have become more value conscious,” he said. “We will move back to where we really should be, which is within affordable luxury” (Wieneberg, 2011; Pandora, 2011a; b).
Pandora altered forecast of 30% growth to zero growth. Company will suspend planned price increases this and upcoming year, will start a strategic review using external consultants, and will present the conclusions to investors at the end of 2012, A.Leighton said. Chief executive officer has resigned with “immediate effect” and board member Marcello Bottoli took over the company. “The CEO of the company is in the end accountable for the performance” A.Leighton said (Wieneberg, 2011; Pandora, 2011a; b).
1.1. Problem statement
This master thesis aims to determine whether Pandora’s value declined along with the market price. Author examines all available strategic and financial factors that affect the value of Pandora with the ultimate goal to estimate the value itself. The problem statement is defined following:
Based on strategic and financial valuation, what is the estimated fair price of one share of Pandora as of 31 December 2011 on a stand-alone basis?
Strategic and financial analysis enables to project the base case, worst case and optimistic case scenarios. Suggestions are provided outside the scope of base case scenario to indicate potential valuation improvements. Core results are summarized in the conclusions and suggestions are provided in perspectives.
Valuation is done on a stand-alone basis, which implies valuation without taking into account the value of any synergies, related with merger and acquisition activities.
Assessment of the value requires comprehensive appraisal of business operations and surrounding environment. Prior issues are addressed in the following table:
| Strategic issues | Model / method | |
| Which macro (external) environment elements determine Pandora’s development? | PESTEL, SPECTACLES | |
| How does the competitive environment influence Pandora’s operations? | Porter’s 5 forces | |
| Which product characteristics are the most important for Pandora customer? | Critical success factors | |
| What distinguishes Pandora from the competitors? | Strategic capabilities | |
| Which micro (internal) elements determine the value creation process in Pandora? | Porter’s value chain | |
| How does Pandora achieve competitive advantage? | Strategy clock | |
| Which Strengths, Weaknesses, Opportunities and Threads face Pandora? | SWOT model | |
| How does Pandora position itself in terms of products and markets? | Ansoff matrix | |
| Where Pandora could be located in terms of growth and market share profile? | BBG Matrix | |
| What is the most likely strategic mode to execute strategies for Pandora? | Strategic modes | |
| Economic and financial issues | ||
| What are the operating and non-operating items within Pandora’s income statement, balance sheet and free cash flow statement? | Reorganization of financial accounts | |
| What are the main components of revenue growth rate? | Revenue decomposition | |
| Which geographical areas contribute largest revenues and highest growth? | Revenue decomposition | |
| Are Pandora’s operations superior or inferior comparing with peers? | Comparison with peers | |
| What are the key factors of Pandora’s profitability? | Profitability analysis | |
| What are the differences between Pandora and peers’ invested capital structure? | Invested capital analysis | |
| How different are Pandora’s value creating elements from peers? | Decomposition of ROIC | |
| Forecasting issues | ||
| What is the most likely development of Pandora operations in future? | Forecasting | |
| How much the base case scenario differs from management guidance? | Comparison with guidance | |
| How does strategic direction influence future operations? | Comparison with strategy | |
| How different are explicit and terminal growth projections? | Terminal growth analysis | |
| Valuation issues | ||
| What is the appropriate cash flow discount rate for Pandora? | WACC | |
| What is the cost of equity and its components? | CAPM | |
| What is the cost of debt and its components? | Synthetic rating | |
| What is the target Pandora capital structure? | Comparison with industry | |
| What is the value of Pandora’s share based on discounted cash flows? | DCF value driver, economic profit | |
| Do all discounted cash flow models provide the same estimates? | Perpetuity FCF, exit multiple, NOPLAT convergence | |
| How sensitive are discounted cash flow model assumption to input changes? | Sensitivity analysis | |
| What is the worst case, optimistic and the probability weighted valuation? | Scenario analysis | |
| What is the value of Pandora’s share based on peer multiples? | Multiple valuation | |
| Is it worth buying shares of Pandora? | Comparison with market price | |
1.2.Methodology
This master thesis is based on fundamental analysis, which comprises thorough analysis of financial statements, company’s business health, management capabilities, competitive advantages, company’s competitors and markets.
This master thesis primarily relies on literature study. Overall theoretical valuation framework is taken from valuation guide written by McKinsey & Company’s consultants Koller, Goedhart and Wessels (2010) and applied corporate finance manual written by Stern School of Business professor Damodaran (2011). Strategic analysis is based on approach of Johnson, Scholes and Whittington (2008).
This paper is based only on secondary sources that are accessible to public. The sources are sufficiently reliable, since most of the theories are applied in practice for long time and auditors or stock exchange regulations certify most of the data.
This thesis uses mostly deductive and less inductive approaches. Many existing theories are applied to arrive to the deductive conclusions and some Pandora specificities leads to inductive conclusions. Pandora financial statements are analyzed from both top-down and bottom up approaches.
Throughout the whole paper Pandora financial performance and strategic position is compared with the peer group. Benchmarking enables to underline whether Pandora performs over or under the average. The peer group (Tiffany & Co, Richemont, Bulgari and Folli Follie) is selected based on the similarity to Pandora operations and the availability of financial data.
This master thesis is constructed so that theories and applied financial analysis are not placed apart, but are tightly integrated. Specifically, methodology is described in accordance to chapters.
Appendix 2: Presentation of Pandora is located in the appendix 2, since it is the least analytical and the most descriptive part. Company’s historic development, overview of products, ownership and stakeholder’s structure, management and corporate governance, markets and sale channels, financial and strategic highlights places the basement for further analysis.
Chapter 2: Strategic analysis unfolds the non-financial value drivers. External environment is analyzed with PESTEL and more detailed SPECTACLES models. Competitive environment is examined with Porter’s five forces models. Critical success factors reveal product characteristics that Pandora needs to pay most attention. Analysis of threshold and unique resources and competences helps to distinguish Pandora from the competitors. Porter’s value chain model helps to identify the clusters where managers should focus in order to develop more profitable business model. Strategic position is summed with the SWOT model. Strategy clock model helps to review the bases on which company might achieve competitive advantage and Ansoff matrix provides a simplified view of four alternative directions for strategic development. BCG matrix enables evaluation of the balance between the different businesses. Finally, Pandora is examined with strategic modes.
Chapter 3: Economic and financial analysis focuses on Pandora financial statements and comparison with the peers. Financial statements are normalized for comparability with peers, valuation of operating and non-operating items separately and exclusion non-recurring items. Economical and financial analysis is done with horizontal and vertical perspectives and connection with strategic conclusions. ROIC decomposition is used to depict elements of superior and inferior performance comparing with peers.
Chapter 4: Forecasting generates future revenue, income, invested capital and ultimately free cash flow projections based on strategic and financial inputs.
Chapter 5: Valuation is the core part of the thesis. WACC approach is employed to determine the discount rate and CAPM is used to detect the elements of cost of equity. The main emphasis lies on discounted cash flow value driver model, but company is examined also with DCF variations: economic profit, perpetuity free cash flow, exit multiple and NOPLAT convergence. Sensitivity analysis is designed to investigate how the changes in inputs affect the valuation and scenario analysis provides probability-weighted valuation. Valuation based on multiples estimates value comparing with peer multiple average.
1.3.Thesis outline
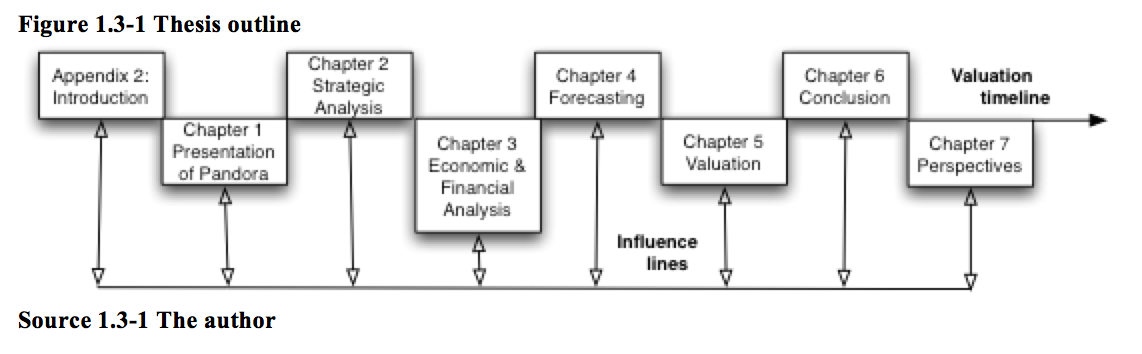
This master thesis is divided into eight parts. Introduction part defines the setting and presentation part portrays the object. Structurally ultimate goal to estimate the fair price is attained through strategic analysis, economic and financial analysis, forecasting and valuation. Conclusions and perspectives are drawn based on the outcomes in the final valuation part, as well as intermediary parts. Even though the main process follows the sequential order, valuation is highly iterative and interrelated process, as shown in the thesis outline figure.
Pandora – financial and strategic evaluation – master thesis – investorship.uk
1.4. Benchmark
Pandora financial accounts and ratios are compared with peers, since relative and not absolute performance displays the positioning and value in the market. In order to have a proper comparison, peer financial statements are reorganized and analyzed with similar thoroughness as it is done with Pandora accounts.
Peers are selected from the list of main Pandora competitors (Pandora, 2010a). Largest charm providers, namely Carlo Biagi, Jewelry, Bacio Italia, Chamilia and Trollbeads are not analyzed, since none of them are listed in the stock exchanges and none of them provide detailed financial statements. Peer group is assembled from the world’s largest fine jewelry players that are listed and provide financial accounts.
Comparison with the largest fine jewelry companies Tiffany & Co (later shortened Tiffany) and Richemont (mother company of second largest Cartier and fourteenth largest Van Cleef & Arpels) is in line with Pandora aims to become the world’s top jewelry firm. Seventh largest Bulgari is interesting from the perspective of what valuation could be under acquisition. Ninth largest Folli Follie is interesting as the most affordable jewelry category player. Extensive description of the peers could be found in the appendix 1.2.
1.5. Delimitations and data collection issues
Master thesis has a time and size restrictions, thus only limited amount of issues are considered. Some of the primary scope and data delimitation issues are enlisted following:
· Valuation is based on fundamental analysis and not on technical or quantitative analysis;
· Valuation is based on stand-alone basis and not on potential synergies, related with merger and acquisition activities;
· Valuation is made as a whole, on consolidated bases, not splitting up the business into parts;
· Valuation is limited with the methods described in the methodology;
· Valuation includes only secondary data, therefore, this thesis replicates the process that could be done by any investor;
· Data is collected and analyzed up to the publication of the annual report of 2011;
· Pandora’s shares are traded for the relatively short time period (from 5 October 2010) and are very volatile.
1. Strategic analysis
To evaluate Pandora’s strategic management it is necessary to understand company’s strategic position and strategic choices. Prevailing strategic position is influenced by external environment and Pandora’s strategic capability (resources and competences). Strategic choices are made in terms of direction (on a business and corporate level) and modes (Johnson, Scholes and Whittington, 2008).
1.1. Strategic position
1.1.1. External environment
Environment is divided into three layers, with increasing relevance and specifics to the company: macro-environment, industry and competitors. PESTEL framework (Oxford university, n.d.) is used to identify how the first layer, macro-environment, might influence Pandora operations.
1.1.1.1. The PESTEL framework
Among political risk factors, Thailand stands in the first place. Thailand’s political scene, fully described in appendix 3.1, has been disrupted by eighteen military coups since the end of absolute monarchy in 1932 and the situation was not much better for the last five years. Pandora was once affected in 2008, when political unrest resulted in the shutdown of the airports in Bangkok, which adversely affected company’s ability to ship products out of the country for a few days (Pandora, 2010a; EIU, 2011a).
The incoming Thailand’s administration is expected to pursue populist economic policies: introduce and by 2020 triple uniform minimum daily wage, but appease businesses by lowering the corporate income tax rate. Pandora locates all manufacturing facilities in the country and thus is directly dependent on its political and partly economical status.
Pandora is dependent on beneficial Thailand’s tax treatments, fully described in appendix 3.2. Thailand’s board of investment approved the latest Pandora’s application for tax benefits for the next five-years, but there can be no assurance that such further tax benefits will be granted on equally favorable terms, or at all. Pandora had an effective tax rate of 18% with tax benefits and 30% without benefits in 1H 2010 (Pandora, 2010a; 2011f).
Pandora might be affected by nationalistic policies that support local producers and restrict import. Nationalism tends to grow particularly in the economic recession time. Even though Pandora’s main markets are liberal and mature, company might face the difficulties in the new markets and even mature markets could surprise, as described in appendix 3.3.
Given the significant number of Pandora entities in different jurisdictions throughout the world, company’s operations could be materially adversely affected by various governmental authorities questioning intra-group transfer pricing policies and asserting alternative claims over the taxation of profits or changing local tax rules and interpretation of tax rules. Even though Pandora follows generally accepted transfer pricing practices in accordance with OECD guidelines and consults with external experts, there is likelihood that tax authorities around the world will have different interpretations (Pandora, 2010a).
No political vulnerabilities are envisaged in raw material producing countries Mexico, Peru, South Africa, US and Australia, as described in the appendix 3.4. It is a very significant factor, since raw materials constitute 92% of costs of goods sold.
From economical environment perspective, in United States, the largest Pandora market, the Congress reached a last-minute agreement to rise the federal government’s borrowing limit, averting the threat of a technical default and reducing scope for short-term fiscal stimulus while failing to address long-term imbalances. Rating agency S&P responded by stripping the US of its AAA rating to AA+, likely pushing up interest rates over time and disrupting the operation of the repo market. According to S&P, the fiscal consolidation plan falls short of what would be necessary to stabilize the government’s medium-term debt dynamics (Standards & Poor’s, 2011).
In United Kingdom almost four years after the global financial crisis hit, economic policy remains in uncharted waters, with enormous levels of financial sector support, record low interest rates and a huge fiscal deficit of 9-10% of GDP. The uncertainty persists: a deteriorating outlook at home and abroad implies that policymakers will come under increasing pressure to provide further stimulus. As skepticism grows over the effectiveness of current policies, it is likely that more radical measures will have to be considered (EIU, 2011b; d).
If not the floods, Australia would be one of the healthiest economies due to heavy concentration on resource sector, which is now soaring (EIU, 2011c).
Germany’s toughest challenge and largest risk to stability in the nearest future is the euro area debt crisis. The euro zone crisis worsened as investors lost appetite for Greece, Italian and Spanish bonds, pushing yields to above 6%. ECB reluctantly restarted its program of bond purchases, which reduced yields but is not sustainable in the long-term (EIU, 2011e).
Pandora – financial and strategic evaluation – master thesis – investorship.uk
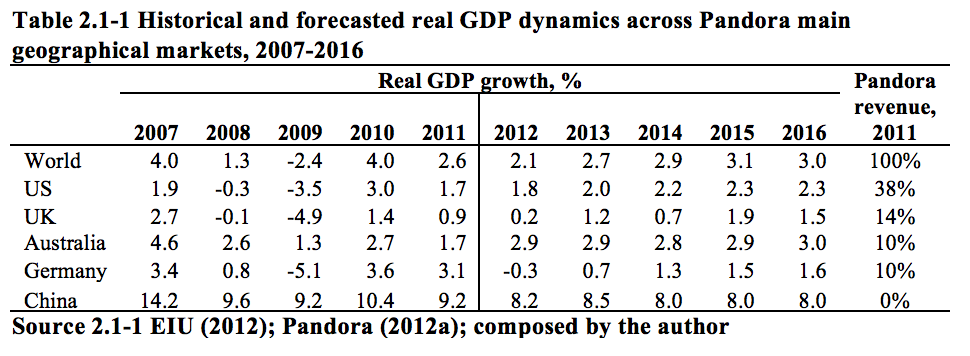
Due to concerns of a double-dip scenario, continued weakness in most economic indicators and sharp declines in the equity market, the recovery of the world economy might be slower. In the latest 2012 review The Economist Intelligence Unit (EIU) cut significantly the growth forecast for developed countries and smaller revisions were made for emerging markets, as described in the appendix 3.5.
Pandora – financial and strategic evaluation – master thesis – investorship.uk
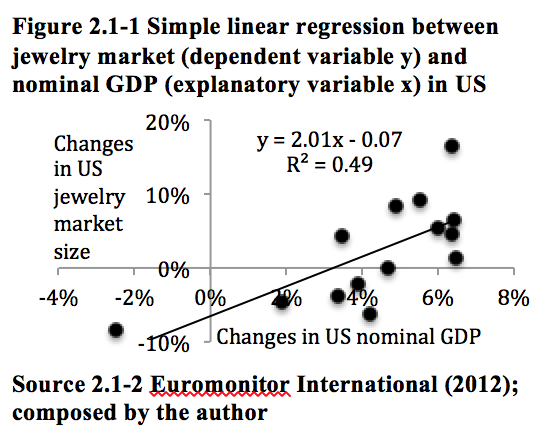
The extent to which economic development influences Pandora performance and more broadly all jewelry market is proven statistically. A data set of fifteen years changes in gross domestic product over changes in jewelry market (from 1997 to 2011) shows that 49% of movements in US jewelry market size is explained by changes in nominal GDP changes. For other Pandora markets (see appendix 3.6 for graphic views), namely UK, Germany and China the coefficients of determination are even higher, respectively 0.74, 0.88 and 0.79.
The regression functions (with the same data set) reveal that a change in the US nominal domestic product by 1% was accompanied with a 2% shift in US jewelry market. However, the jewelry market sensitivity to nominal GDP changes is lower in other Pandora markets – UK regression slope equals 1.15, Australia 0.83 and Germany 1.01. In China 1% change in nominal GDP is accompanied with 1.75% jewelry market change. The majority of regression functions supports the general understanding that jewelry industry belongs to cyclical industries with volatility being higher than the general market[1].
Pandora – financial and strategic evaluation – master thesis – investorship.uk
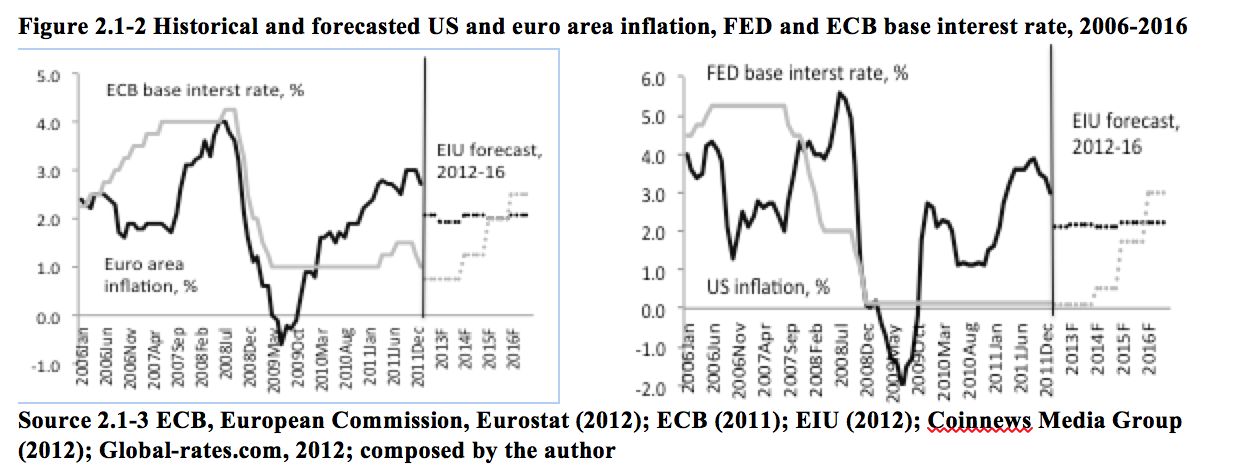
Global currency markets have become more volatile as the outlook for economic growth has dimmed and the crisis in the euro zone has intensified. The global slowdown has created a rising demand for safe-heaven currencies, in particular the Swiss franc. Pandora relevant currencies Australian dollar and Thailand baht are expected to strengthen against dollar, while British pound is forecasted to be weaker. Recently US dollar began to climb against euro as ECB raised base interest rate to fight against rising inflation.
According to new ECB president, inflation[2] is expected to remain above 2% threshold in 2012 and come down below threshold in 2013. According to EIU (2012), US inflation rate is projected to volatile at 2% threshold. Inflation assessment is done in the appendix 3.7.
Pandora – financial and strategic evaluation – master thesis – investorship.uk
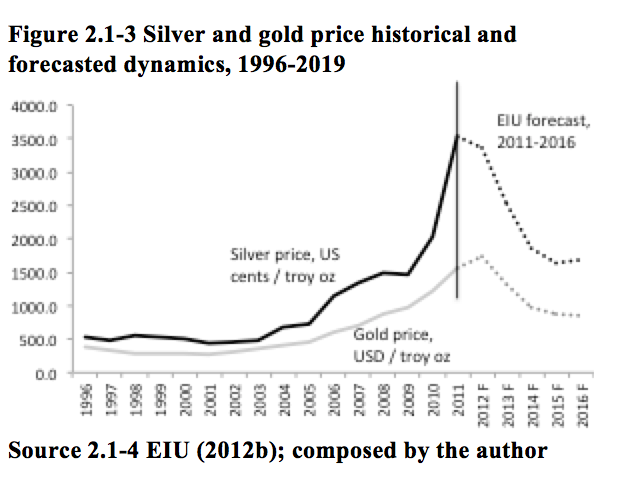
Fluctuation in prices of the raw materials is another serious concern. Pandora uses diamonds, precious and semiprecious stones, pearls, Murano glass, wood, leather, various alloys, but the main cost elements are silver and gold. Investor buying has intensified amid turmoil in the global capital markets, fuelled by anxiety over European and US sovereign debt issues, ongoing political crises in the Middle East and North Africa (MENA) region and the ultra-low global interest rate environment. In the nearest future physical and speculative demand should remain strong, while by 2013 tighter global monetary conditions and anticipation of a return to positive real interest rates should encourage some profit taking and a switch out of gold and silver, leading to a fall in prices (The London Bullion Market Association, 2012; EIU, 2012).
From employment perspective Thailand plays the most significant role, since Pandora hires in this country 69.4% of its workforce and saves a lot on wages comparing to companies employing labor in developed countries. Thailand unemployment rate in 2011 and 2010 was particularly low – only 1%. Even though the unemployment rate is expected to increase in the nearest future, it will not go above 2% for five years ahead, according to EIU (2012a). It means that Pandora will have to pay salaries at the rate of Thailand economic development.
The primary social environment driver is the customer. Pandora identifies its target end-customer as 25-50 years old woman. Company aims to fit into the affordable jewelry category, but also offers exclusive collections. Broad range of offerings enables company to reach all women within the defined age.
It is arguable whether Pandora should not go beyond the defined age and, perhaps, it is meaningful to differentiate its assortment among different age groups. The figure 3.1-5 illustrates that Pandora target age group in UK earns 56.7% of total income. It is understandable why Pandora does not target the nearest age band of 20-24 years, since it earns significantly lower portion of income (4.7% of total). However, older nearest group 50-54 earns 11.1% and 55-59 years old collects 8.6% of total income. Plus, the mean income of the last two categories is quite similar to Pandora target age group mean income figures.

Pandora – financial and strategic evaluation – master thesis – investorship.uk
Jewelry product is highly driven by fashion trends and social values. In order to forecast Pandora’s performance, it is necessary to grasp underlying trends and dynamics. To begin with, women recently started to shift from gold jewelry to silver jewelry, since silver jewelry tends to be more fashionable and affordable, according to a research by Mintel (2011 cited in CBI, 2011c). What is more important, the economic recession and high jewelry prices in Europe has affected overall consumption of precious metal jewelry to decrease and costume or design jewelry to increase (CBI, 2011d).
The same Mintel survey reveals that precious metal remains an important gift item, with 2/5 adults enjoying receiving precious metal jewelry as a birthday or Christmas present. As a result, two thirds of Pandora jewelry sales commence in the second half of the year (CBI, 2011a; Pandora, 2012a).
British women, who are often trendsetters, move away from “statement” pieces towards more refined and well-designed pieces expressing an “emotional” value and that can be worn longer. Consequently, engraved and other personalized jewelry are the popular items (CBI, 2011b). Similar trends are observed in Germany (CBI, 2011c).
Another trend is to mix and combine materials, such wooden beads, terracotta beads, shells, bones, enamel, Venetian glass, crystals, leather, rubber, ribbon, silk, coconut and copper (CBI, 2011a). As a result, costume or design jewelry is gradually taking the place of traditional precious metal jewelry. (CBI, 2011a)
Ethical jewelry and the issue of fair trade have become more important for consumers. Jewelry has widened its presence in fair trade retail outlets and ethnic groups constitute larger part of the overall population. Detailed analysis is presented in the appendix 3.8 (CBI, 2008; 2011a).
There is a growing number of working women and women in higher professional roles, which means higher levels of disposable income. For instance, in Germany working woman category expanded from 59.8% in 2005 to 65.5% in 2009. An increase took place in the older age group (55 to 64 years), while the ratio of the younger age group (15 to 24 years) decreased. As more women join the German workforce, there is a growing market for jewelry as an important fashion accessory being worn daily. In whole EU27 area, between 2005 and 2010, the ratio of working women rose from 56.3% to 58.2% (CBI, 2011c).
As the importance of social media rises, women are more influenced by on line fashion blogs, music, fashion TV or social networks. Women are also attracted by jewelry collections from celebrities as trends setters (CBI, 2011a).
Technological developments have influenced jewelry design in a variety of ways: (1) jewelers could no longer imagine industry without laser-cutting and computerized technologies, described in appendix 3.9 (JKC Magazine, 1999), (2) technology could upgrade the material, described in appendix 3.10, (3) offer more possibilities in design variations and (4) technological fusions could create a perception of innovative style.
Through technology jewelers have the ability to create and engrave variety of lifestyles and thus personalize the jewelry. Technologies provide freedom to experiment for the customer and ability to make business more efficient and profitable for companies.
The environmental issues are numerous (detailed analysis in the appendix 3.11) and become more important: mine waste, use of dangerous cyanide in gold mining, danger for the fauna. One of the peers Tiffany not only signed the pledge, but also campaigned against the mines. Activists urge jewelers to question suppliers about their gold sources and to use recycled gold (Bates, 2010).
Consumer consciousness of environmental issues grows together with acceleration by media. The green movement interweaves environmental goals with a sense of personal and social responsibility. Sustainable practices use resources without depleting them or permanently damaging the environment that yields them. For jewelers, sustainable business practices begin with analyzing their supply chain. Decent green benchmark practices include capturing and reclaiming all precious metals, encouraging customer to recycle their precious metals, controlling water usage, reducing toxic and chemical usage, reducing and recycling packaging and educating each other (Dhein, 2008).
There are numerous legal issues affecting jewelers, of which several take special attention: (1) jewelers should get warranties from their diamond jewelry suppliers, (2) dealers in precious metals and gems must establish programs to prevent their businesses from being exploited for criminal purposes, (3) jewelers must be aware of new customers, suspicious transactions, offers to pay in large amounts of money, inability to provide identification and usual payment methods, further explained in appendix 3.12 (JKC Magazine, 2004).
Importance of disclosure and description rises: (1) companies must provide detailed description of materials used, for instance, whether gemstones are synthetic, (2) sale receipts are treated as contracts, with necessity to specify what is sold and include the customer’s name, address, date of sale, customer’s signature, which acknowledges their awareness of the store’s policies, return and refund policies (JKC Magazine, 2004).
One of the largest industry concerns is copyright protection. Failure to protect adequately intellectual property enables competitors to copy the concept. In addition, many designs cannot be easily protected by copyright, because they are insignificantly different from simple standard shapes (JKC Magazine, 2004).
In addition to PESTEL’s six macro environment factors, SPECTACLES model adds four important dimensions: cultural, aesthetic, customer and sectorial.
Different cultures have different tastes for jewelry. A cultural subgroup could be differentiated by status, ethnic background, residence, religion, and position in time. Cultures tend to mix and combine different elements together with globalization, described in appendix 3.13.
In developing countries there is a growing trend of individualization and spiritual jewelry. Consumers tend to search for a deeper meaning to life, which can be eastern religions, astrology, tribalism or foreign cultures with each having its symbolic jewelry (CBI, 2011e).
While some fashion experts say aesthetically minimalism is a key fashion trend at the moment, others would say it is a never changing classic (more in appendix 3.14). Aesthetics is particularly important within stores. Store aesthetics enables to differentiate customers and influence purchasing behavior (Silwa, 2011).
Knowing how to serve different types of jewelry customers is critical. According to Tim Malone (2011), there are six distinctive jewelry shopper types to be aware: task, value and price oriented, discerning, abundance and experiential. Analysis of each type is depicted in appendix 3.15.
Since jewelry sector belongs to consumer cyclical industries, the forecasted economic “double dip” could affect jewelry companies more than market average. Another sector specific is the concentration of a substantial portion of industry’s sales in relatively brief selling periods during the year, meaning that performance is susceptible to significant periodic fluctuations.
Recently, jewelry is increasingly linking up with other sectors. This is an opportunity for the development of silver jewelry that is integrated into handbags, belts, footwear, beauty cases, eyewear, clothing, watches and electronics. There are also opportunities for accessories’ such as jewelry boxes or ring holders.
Timing and speed are very important characteristics in jewelry market. New fashion collections for seasons are usually launched at trade shows a year ago. This implies that new jewelry are developed and produced well over a year ahead of when they are on sale. Production processes need to be flexible in order to be able to respond quickly to changes in product design (CBI, 2008).
To sum-up, jewelry industry is a very fragmented and dependent on external environment. Economic factors play the most significant role, but from strategic perspective, two other factors are of key importance – social/cultural and technological issues. By foreseeing or failing to understand the coming trends in customer behavior and offer the right product to fill the need, jewelers either thrive or strive to survive.
Pandora – financial and strategic evaluation – master thesis – investorship.uk
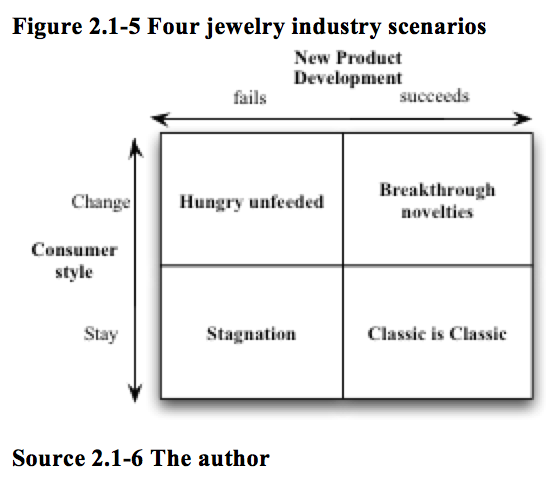
Consequently, four scenarios could possibly shape the jewelry industry: (1) under “hungry unfeeded” scenario jewelry companies are under pressure to invest more in new product development, jewelry market are volatile, fragile and with high turnover of players; (2) under “stagnation” industry gradually looses sales volume to other similar industries; (3) “classic is classic” scenario marks the resistance within discoveries, when innovators do not get return on their investment and looses incentive to invest further; (4) finally, “breakthrough novelties” offers both change of consumer style and advance in new product development, leading to growth of multinational companies.
1.1.1.2. Porter’s five forces framework
Pandora sells affordable jewelry, made of precious metals and often combined with precious and semi-precious stones and thus could be assigned to global fine jewelry market, which was estimated to be 145 bUSD in 2009. Measured on retail revenues, Pandora had a share of 1.2%[3]. Global fine jewelry market has been growing +2.9% annually from 1999 to 2009 and +4.2% excluding recent economic downturn in 2008 and 2009 (Pandora, 2010a).
The fine jewelry market can be split into three price segments: affordable (less than 1500 USD per piece), luxury (1.5 – 10 tUSD per piece) and high-end (more than 10 tUSD per piece). The affordable segment accounted for 57%, or 83 bUSD, of total fine jewelry market in 2009. Second largest segment was luxury with 29% share and the last – high-end jewelry with 15% share (Pandora, 2010a).
Affordable segment was growing at a higher pace comparing with other segments. Before economic crisis, from 2005 to 2007 annual growth of affordable jewelry was +4%, comparing with +3% growth in total fine jewelry market. At the crisis period from 2007 to 2009 annual growth rate of affordable jewelry dropped to +1%, while whole market CAGR was -2%. Affordable segment benefited from consumers trading down the luxury and high-end jewelry segments. The luxury and high-end jewelry segments were particularly affected by the economic downturn in 2009, as consumers delayed or refrained from purchases of high priced items and retailers applied heavy mark-downs to clear their inventory (Pandora, 2010a).
While the fine jewelry market has been undergoing a long-term trend toward branding across all price segments and regions, the market is still predominantly unbranded. In 2009, branded fine jewelry accounted for approximately 19.3%, or 28 bUSD, of the fine jewelry market, compared with 60%, 50% and 38% for the respective worldwide markets for watches, leather goods and eyewear. Within affordable category, branded sales constituted 24% of sales. In 2009, the top 15 global brands by retail revenue accounted for approximately 40% or 11 bUSD of the branded fine jewelry market. The remaining 60% of this market was fragmented across approximately 1000 brands (Pandora, 2010a).
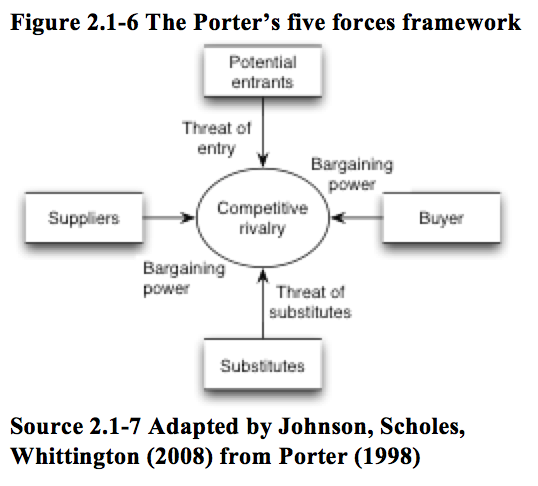
Porter’s five forces framework is useful in understanding the attractiveness and potential threats of the industry (Porter, 1998). The forces are dynamic: companies (1) destroy the barriers and enter the market, (2) build the blockades and creates threat of entry, (3) overcome barrier to enter new industry and (4) are eliminated by other competitors. Pandora is at the stage to build barriers in existing markets and break the obstacles in new markets. Jewelry industry is characterized as extremely competitive and low barricaded.
Pandora – financial and strategic evaluation – master thesis – investorship.uk
In terms of scale and experience, low investment requirements to set up jewelry company makes it relatively easy to enter the market. Economies of scale are basically inexistent, because product is not standardized and buying habits are very varying.
In terms of access to supply and distribution channels, there are numerous raw material suppliers “at the bottom” to get the materials and there are numerous multi-brand jewelry retail stores “at the top” to distribute the production. Competition is extensive at both levels.
Industry is also absent of expected retaliation feature, as existing firms do not fight with the price war after every single new player enters the market. It is also not the industry to be afraid of legal restrains.
The only significant barrier to enter is differentiation. Incumbents differentiate by selling jewelry with higher perceived value. Customer loyalty is created and maintained through combination of quality and branding.
Managers tend to focus only on competitors in their own industry and overlook the threat of substitutes, such as watches, cloth elements, handbags, accessories, perfume, cosmetics or even tattoos. There are two important elements to consider: extra-industry effects and price/performance ratio (Johnson, Scholes, Whittington, 2008). The first element is the core of substitution effect: the more substitutes become available outside the industry, the more demand of buyers is elastic and consequently industry is less attractive. Close substitution constrains the ability to raise the prices, which is one of the key important sources for profitability. Overall jewelry demand elasticity is high, but varies across different segments.
Substitutes are not only those items with similar prices, but also those that have similar or better price to performance ratio. For instance, watches are usually more expensive than jewelry, but offer important functionality – time and date output. Watches balance between style and functionality and therefore could be also assigned to jewelry category. It is therefore not surprising that Pandora is also trying to enter the market of watches. Moreover, watchmakers recently started to include various other beneficial functionalities, such as health measurement, weather forecast and calendar. As a result, substitutes should be seen from dynamic perspective, with potential to become substitutes in the future.
Clothes are usually cheaper in price and could offer less feeling of luxury as jewelry, but they also have important functionality. Clothes could also be very stylish, equally giving opportunity to show style and taste. Clothes certainly could include precious materials, which would move them closer to jewelry category.
Handbags, accessories, perfume, cosmetics or tattoos must all be also monitored through price and functionality ratio. Consumers have limited resources to spend and they could at any time shift resources from jewelry. Question of functionality becomes especially important at economic crisis time. Since jewelry has very little functionality, changing consumer habits towards functionality directly leads to losses for jewelry industry.
In addition, if to take fine jewelry separately from costume jewelry, the latter would be the most significant threat, as it is rapidly getting popular. Design jewelry is cheaper and offers wider possibilities to express creativity.
Since Pandora is a wholesale company, bargaining power of buyers is executed through retail shops, grouped into mono-brand and multi-brand resellers. Naturally the mono-brand retailers have less bargaining power, because they are reselling only Pandora product and could not easily switch to other products. The multi-brand shops have more bargaining power, but it is also very limited, since they are typically small shops or at most small retail chains. Buyers exercise their power only due to low switching cost to competitive products. Multi-brand shops offer variety of jewelry brands and if one is not successful (among ultimate customers), the order from supplier stops. The more powerful is the buyer, the lower revenues and profitability could be achieved. From Pandora perspective, mono-brand shops generate significantly higher revenues comparing to multi-brand shops.
Pandora is a vertically integrated company, thus power of suppliers is executed only from external suppliers, providing raw materials, equipment, labor force and financial capital. Most of raw materials used in production are precious or semi-precious commodities, which are traded worldwide in huge quantities. Even though two suppliers source 90% of silver supply and five suppliers provide 80% of gemstones, their power to bargain on prices is limited. On the other hand, the same is true for Pandora – it is not possible to get prices lower than quoted. From raw material production perspective, 20 silver companies produce 50% of world silver and 10 gold producers account for 78% of world gold production (The Silver Institute, 2011). As both resources are limited, prices fluctuate depending on demand, rather than production.
In terms of equipment and financial capital, Pandora has high bargaining power due to relatively low switching costs and diffused suppliers. In terms of labor, Pandora has again high negotiating power despite significant exposure to Thailand labor market. Company employs 3600 people in Thailand, but most of the positions are within production field, where availability for substitution is high. Moreover, labor is not united under labor unions. It is however sure that bargaining power will grow with the rise of Thailand economy.
Competitive rivalry between Pandora and immediate competitors is distributed unequally. Suppliers and buyers have little power to bargain, while low barriers to enter and threat of substitutes causes high competitive environment.
The primary factor to high degree of rivalry is the number of competitors (appendix 3.22). Even though the number of firms in Pandora markets decreases, the tempo is slow and concentration will not be high for long time. What is more surprising, number of big players is decreasing at even higher pace (except UK). One possible explanation is economic crisis, another – low possibilities to scale the operations.
In terms of local jewelry firms’ revenues, the trend is similar, except again UK (appendix 3.23). Turnover of all US jewelry firms fell at an annual decline rate -3.1% in the last six years and for companies with more than 100 employees CAGR was -3.7%. In Germany figures are similar and only UK experiences some consolidation of larger firms. Negative growth of the market poses another issue – growth could be only at the expense of a rival.

Pandora – financial and strategic evaluation – master thesis – investorship.uk
The dynamics of the production volume confirms parallel with the economic development. US production volume has increased by 22.6% from 1997 to 2000, dropped by -11.6% in 2001, further increased by +4.2% from 2001 to 2005 and decreased by -38.8% from 2005 to 2011. Over fourteen years compound annual decline equals -2.6%, while over last six years decline intensifies to -7.8%. The situation is even worse in Germany, where six years CAGR equals -10.7%.
The collapse in volume is partly offset by an increase in producer prices: six-year annual average of +5.1% in US and +6.4% in Germany. The decrease in local production is substituted by the higher imports, reaching 73% in US, 75% in Germany, 99% in Australia and 49% in UK of total market. Total market size expands across all geographic regions in economic prosperity time, but significantly differs in the period of crisis: UK and US markets plummeted below 2005 level, Germany and Australia experienced an annual growth rate of +0.9% and +8.4% growth respectively.
Industry analysis provides several implications:
· First, industry has neither high fixed costs (rivalry increasing factor) nor high exit barriers (rivalry decreasing). It is therefore healthy to try to expand into new geographical markets, what Pandora in fact has been trying to do;
· Second, jewelry market slows down in developed countries and expands in emerging markets. While Italy market has increased by comparable to old Pandora markets annual growth rate of +0.8%, Japan and Russia grew by CAGR +7.2% and +9.4% respectively and China climbed by impressive +25.5% speed. Naturally, different growth rates and distinct market specifics demand distinctive entrance strategy. Pandora’s experience lies in entering the developed markets, thus entrenchment into emerging markets (definition in appendix 3.25) could take some time and if at all is possible;

Pandora – financial and strategic evaluation – master thesis – investorship.uk
· It is certainly also attractive to enter parallel industries, such as design jewelries, which are growing faster than the fine jewelry market;
· Since the rivalry in the fashion industry is high, one of the best ways to survive is to increase advertising costs and strengthen customer loyalty;
· Vast possibilities to reduce rivalry lay in differentiation. Extensive branding is certainly one of the most direct ways to display company’s authenticity.
1.1.1.3. Critical success factors
Critical success factors are product characteristics valued by the customers the most. Even though company might be competitive within the industry, failure to address the target customer needs could lead to a failure in operations.
In the research of shopping motives Tauber (1972) indicates 14 functional and 12 nonfunctional motives that affect the buying decisions. Sanguanpiyapan and Jasper (2009) recently examined Tauber’s motives at jewelry retail outlet and found out that all motives are statistically important, but jewelry shoppers are more influenced by functional motives. After adjustment (appendix 3.16) six most important motives are assortment, convenience, brand, design, service and price.
The results are inconsistent with other findings. For instance, Jamal and Gode (2001) found out that primary precious jewelry purchase attributes in UK are quality, design, warranty, comfort, price, assortment, brand, value and country of design (COD). Comparing to the previous research, this is a more reliable (due higher sample and smaller standard deviation), but older research (appendix 3.17).
Some explanation to the confusion of why the attributes of luxury goods shopping vary is obtained from Aielo, et al. (2009) survey of 165 students from 8 countries (appendix 3.18):
· The answers differ depending on whether students are asked to evaluate the product or state the motives of purchase decision. Within product evaluation, the ranking of the most important attributes of specialty luxury goods are brand, design, warranty, COD and price, while within purchase decision, the ranking is completely different: design, brand, price, COD and warranty.
· Specialty luxury goods (for example luxury cars, professional photographic equipment and high fashion clothing) are valued very differently from convenience (for example soap, newspapers and milk) and shopping (for example furniture, electronics and inexpensive clothing) goods. While the latter two categories are characterized by price factor dominance, the opposite is true for luxury goods.
· Almost all attributes (except price) within specialty luxury category are more important than in convenience and shopping good categories. It seems that shoppers are ready to spent extra money and pay extra price on luxury goods only when all attributes are at the highest level.
1.1.2. Strategic capabilities
Internal strategic capabilities distinguish Pandora from the competitors permitting company in some respects to meet the necessary minimum requirements to compete in the jewelry market (threshold capabilities) and in some respects, generate superior product (capabilities for competitive advantage). Strategic capabilities are divided into resources (tangible and intangible) and competences to deploy the resources efficiently. These four dimensions merges into four blocks.
Threshold resources:
§ Even though Pandora has an extensive portfolio of different jewelry pieces, only three kinds of jewelry bring more than 5% of total sales: charms, charm bracelets and rings. Therefore, competitive assortment of 1800 designs (with annual introduction of 250 new designs and retirement of 150 old ones) is a threshold and not yet a unique resources;
§ Company built a high network of retail shops (10732 in the end of 2011), which results in stronger competition and consequently higher margins for Pandora. Retailers are widely spread through all continents, meaning inexpensive promotion of Pandora globally;
§ Among financial resources, company has a strong sponsor PE fund Axcel, which potentially could attract money to fund company’s operations. However, they have already taken out a large portion of investment through selling shares in IPO and now focus on investments outside Pandora;
§ Another threshold resource is a diverse range of employees, most of them who are trained in-house;
§ From intellectual capital perspective company made several significant acquisitions that added large intangible assets. Intangible value is indirectly measured through goodwill, which equaled 1.9 bDKK, or 24% of assets at 31 December 2011.
Threshold competences:
§ Company has standardized production processes, which are necessary to manage huge resources. Company was acknowledged with ISO 9001: 2008 certification through testing 50 procedures including order processing, purchase and production planning, quality control, customer relations and human resource management.
While threshold activities are important, they do not create competitive advantage. Unique resources underpin competitive advantage that cannot be imitated:
§ First unique resource to mention is a product charm, which brought initial success in 2000 and keeps generating substantial revenues today;
§ Another important physical resource is the four state-of-the-art production facilities, of which two (combined production area of 13000 m2) were opened in 2010. All facilities are located in Gemopolis, a jewelry business zone on the outskirts of Bangkok, Thailand. In 2010 company produced 57 million pieces of jewelry, comparing to 3 million in 2004. In addition, the fifth plant of 10710 m2 area and 70 mDKK investment was expected to be operational in 4Q 2011;
§ Pandora production team in Thailand employs more than 3600 people. Thailand workforce is relatively inexpensive, skilled and trained in-house;
§ Furthermore, in-house designers from Denmark have a long track of success creating various lines of jewelry. Denmark is known for design driven solutions and demanding customers, thus it is a good place to create a design and test the products with the customers;
§ Financially company is empowered to expand and balance the working capital with 2.5 bDKK revolving credit facility, agreed till March 2014;
§ Most precious intellectual resource lay in the brand, which was valued at 1 bDKK, or 13% of total assets in 31 December 2011. In addition, brand awareness among target customers were 51% in 1H 2011.
Core competences:
§ Extensive manufacturing experience (more than 20 years of jewelry manufacturing in Thailand) inevitably leads to the best in class and difficult to imitate practices. Manufacturing processes were controlled and now supervised by the founder;
§ Core competence is also the management’s ability to scale the craftsmanship, produce hand-finished products in mass quantities;
§ Pandora also had superior abilities to successfully enter new markets in a relatively short time period;
§ Despite recent turmoil, still an outstanding financial performance speaks about strong financial consolidation and control functions;
§ Pandora has a difficulty to replicate win-win retail proposition. Pandora offers retailers lower rent expenses by requiring lower selling space (<5 m2 versus an average of 170 m2 in US); high turnover rates per square meter (50 tUSD/m2 versus 6500 USD/m2); high turnover rate (3-4 per year versus 1 per year); gross margins of 55% versus 50%; marketing spend 2.5% versus 4-6%.
1.1.2.1. Value chain
Porter’s (1998) value chain (appendix 3.19) is beneficial twofold: a generic description of activities helps to understand, if there is a cluster of activities providing benefit to customers within particular areas and, second, identification of cost and value of activities helps to detect where managers should focus in order to develop more profitable business model.
Generic description of activities starts with the primary activities that are directly responsible for creation and delivery of a product:
§ Pandora has a warehousing and logistics team, which is responsible for inbound logistics: receiving, storing and distributing inputs. Area’s cost efficiency comes with warehouse facilities being located near production site in Thailand and having internal demand planning department, which collects, consolidates the expectations of the markets and forecast market demand for production capacity;
§ Some of the key Pandora competitive advantages lay within operations, such as 22 years of jewelry manufacturing experience in Thailand, 4 state-of-art plants, founder’s goldsmith skills, cost efficiency in Thailand;
§ The same warehousing and logistics team controls the outbound logistics, which is positive in terms of know-how and data consolidation. However, a decision to distribute the products through central warehouse in Denmark, which serves as a transit location except for US and Australia, seems to be time and transportation cost inefficient. It makes little sense that after central warehouse in Denmark goods travel to 8 local warehouses or third party distributors around the world. This activity can prove to be extremely important both in generating value and in improving differentiation. In many industries control over distribution is proving to be a major source of competitive advantage. As it is shown further down, 50% of the value created in many industry chains occur close to the ultimate buyer. Taken that in consideration, company already made significant step to consolidate external distributors. As a matter of fact, Pandora revenues from third party distribution accounted for 4.9% of total revenues in 2011, down from 54% in 2008;
§ For a long time marketing and sales activities were decentralized, leaving regional partners to make their own decisions. Pandora entered US, Australia and many European markets with the help from local entrepreneurs. Private initiatives were very important drivers for expansion and entrepreneurial character should still form part of company’s DNA. Currently model of marketing and sales is centralized with unified strategies. Company has also changed regional sales directors, who initially started the business. It brings several consequences: (1) abilities to execute unified approach, (2) more control over marketing and sales, (3) coping with scale and higher level of tasks with the help from more experienced management, but on the same time (4) loss of entrepreneurial mechanism and (5) loss of know-how. As indicated before, company sharpens its marketing and sales with superior win-win proposal for retailers`;
§ Pandora delivers a service to end-customers through retailers with franchise contracts. Even though Pandora has all rights and power to demand from the high service standard from retailers, full control is definitely not possible. To ensure that products are displayed in accordance to Pandora retail guidance, and product assortment level reflects the end-consumer needs, company makes 12 sales representative and visual merchandiser visits per year for mono-branded shops, 6 for silver level and 4 for white level shops. Company generally tries to shift away focus from after-sales activities (less than 1% of revenues), keeping it only at the threshold acceptable level (Pandora, 2010a).
Each of these primary activities are linked with support activities, serving as a help to improve the efficiency of primary activities:
§ Pandora’s procurement department ensures that the company has the necessary raw materials by maintaining adequate supplies and keeping in constant communication with production and demand planning teams. Even though the cost of procurement is relatively low, the impact could be significant, as it inspects raw materials and semi-finished goods, establishes relationships with suppliers, checks if the suppliers do business in accordance to the company’s CSR;
§ Technology development (see appendix 3.20 for full analysis) belongs to Pandora’s core competence, since it includes product design, R&D and process development. It is the starting area of Pandora’s vertical integration and primary source for all value chain;
§ Number of employees in Pandora rose from 1288 in 2008 to 5186 in 2011, inevitably making human resource management function of high importance. To address safety and healthy working environment issues, in 2010 Pandora initiated the process of being certified according to OHSAS 18001: Occupational Health and Safety. Average compensation per one employee rose from 108 tDKK in 2008 to 192 tDKK in 2011. Pandora saves on wages in Thailand and attracts experts by paying high salaries to top managers. Whereas typical EU jewelry company spends around 44% of cost of goods sold (COGS) for direct labor cost, Pandora spent only 10% in 2011, up from 5% in 2008. For the nearest future, the savings on labor in Thailand should remain a critical competitive advantage;
§ Historically Pandora infrastructure was decentralized – financial reporting system was based on reporting structures in local markets. Currently Pandora undergoes the process of implementing a more comprehensive group-wide monitoring system. As a result, some of group-wide internal controls are relatively new and might possibly require further adjustments or modifications. From the perspective of finance, company has a widely experienced financial investor Axcel.
Value adding activities are positioned within the supply chain (see appendix 3.21) to identify and separate cost and value activities. Combined picture enables to draw several important conclusions:
· The closer the activity is to the ultimate buyer, the more value is created: retail represents 59% of all value created, wholesale and distribution has a share of 14.1% and manufacturing only 7%;
· Even though Pandora does not participate directly in the retail segment, its prices are half way to complete vertical chains. Typical wholesale jewelry company sells the products for 2.06 symbolic unit, when costs of goods sold equals to one. If the same analogy is applied to Pandora, revenues equal to 3.1 and COGS equal to one in 2011. Full typical mark-up ranged from 4.44 to 5.78;
· Typical EU jewelry attributes 44% of costs of goods sold to material costs, another 44% to direct labor and 12% to other costs.
Breakdown of value added activities shows that Pandora would highly benefit from full vertical integration. There are several moments to consider: (1) current model offers speed and flexibility to launch and change product assortment, (2) capex and management time is focused to production development and capacity increase, but (3) company looses significant portion of value added, (4) has less control over the distribution and brand positioning and (5) significantly depends on variable costs, comparing to scalable fixed retail costs.
1.1.3. SWOT model
After defining business environment and internal strategic capability, overall strategic position could be summarized with SWOT model. In addition, following SWOT analysis should be read as a collection of most important elements in comparison with main competitors:
| Strengths:
§ Experience and state-of-art facilities in manufacturing § Superior design and new product development § Vertically integrated business model with higher profit margins |
Weaknesses:
§ Too high reliance on a sole product – charms § Inability to capture majority of the value added that comes from retailing § Inexperience to implement centralized management model worldwide |
| Opportunities:
§ Growth of affordable branded jewelry segment § Convergence of style and buying patterns in developing markets with developed markets § Higher demand of “create and combine” concept in other product categories |
Threats:
§ Price increases of gold, silver and other main raw materials § Popularity of substitutes, where costume jewelry is of the biggest concern § Further economic downturn in US and Europe |
1.2. Strategic choices
Pandora – financial and strategic evaluation – master thesis – investorship.uk
| 1 ‘No frills’ | Likely to be segment specific |
| 2 Low price | Risk of price war and low margins; need to be cost leader |
| 3 Hybrid | Low cost base and reinvestment in low price and differentiation |
| 4 Differentiation:
a) Without price premium b) With price premium |
Perceived added value by user yielding market share benefits Perceived added value sufficient to bear price premium |
| 5 Focused differentiation | Perceived added value to a particular segment, warranting price premium |
| 6 Increased price / standard value | Higher margins if competitors do not follow; risk of losing market share |
| 7 Increased price / low value | Only feasible in monopoly situations |
| 8 Low value / standard price | Loss of market share |
| Source 2.2‑1 Faulkner and Bowman (1995); Johnson, Scholes and Whittington (2008); composed by the author | |
On a business level Pandora needs to decide how to position itself in relation to competitors. Porter (1985) offered three broad strategies to achieve competitive advantage: cost leadership, differentiation and focus. Since the strategies are not clearly defined, another approach, called ‘Bowman’s strategy clock’ by Faulkner and Bowman (1995) is employed.
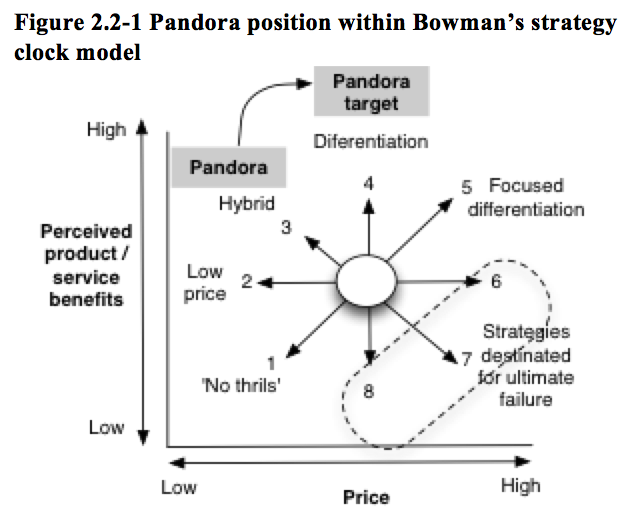
Strategy clock model (described in 3.2-1) helps to review the bases on which company might achieve competitive advantage. This model extends Porter’s (1985) three strategic positions to eight and explains the options in light of the price and perceived value to the customer combinations. In addition, model helps to identify the likelihood of success for each strategy (Johnson, Scholes and Whittington, 2008).
Pandora is in between “hybrid” and “differentiation” strategies. On one side, company is clearly differentiated with the superior designs, concept “create and combine” and manufacturing quality, on the other side, it tries to fit into affordable price range. Hybrid strategy is advantageous, when (1) much greater volumes can be achieved comparing with those of competitors, so that margins could be still better and (2) as an entry strategy in a market with established competitors.
The hybrid strategy ceased and differentiation started when the Pandora prices started to surpass affordable range. The aim of the differentiation strategy is to offer different benefits at adequate price levels that are comparable with those of competitors. The success applying this strategy is dependent on two key factors: identifying and understanding the strategic customer and identifying key competitors. There are at least two problems that Pandora faced entering this strategy: (1) competitors partly erased company’s distinctiveness by starting to imitate the very successful charms and the concept to “create and combine” and (2) customers were sensitive to further price increase at the time of economic downturn.
In order to sustain the competitive advantage through differentiation, Pandora could go two ways: build the barriers for competitors (particularly imitators) and lock the retail partners by increasing switching costs. What Pandora already does, is (1) taking advantage of imperfect mobility of resources and capabilities, such as intangible brand, image and reputation assets and (2) creating numerous requirements to its retail partners.
Pandora needs to build multiple biases of differentiation to be able to respond to a threat of competitors properly. For instance, focus might be placed not only on design and quality, but also on innovation, which could potentially diversify its product revenue structure and reduce the one product risk. Pandora should also seriously consider establishing several brands to capture low and high price sensitive customers.
In addition, Pandora could use various forms of collaboration. One form is to increase selling power, for example establishing joint research and developing activities. Second form might be to build barriers to entry, for instance joint marketing function and trade association to promote jewelry technical specifications and safety standards. So far Pandora used collaboration to enter new markets with regional sale forces. Company also collaborated with retailers to increase cost efficiency, quality and reliability.
1.2.2. Corporate level directions
On a corporate level Pandora selects products and markets to focus. The Ansoff (1957) product and market growth matrix provides a simplified view of four alternative directions for strategic development.
1.2.2.1. Ansoff matrix
As of today Pandora mostly pursues ‘diversification’ strategy, which resonates in dimensions of markets and products. In terms of product development, Pandora early creates or recreates 150-250 new designs. Recently company also entered non-jewelry category – watches and plans to enter sunglasses. New product development is expensive and high-risk activity due to two reasons: (1) requirement of new strategic capabilities, such as mastering new watch technologies and (2) project management risk, such as postponement to launch distribution of glasses due to quality concerns. To solve these issues, Pandora outsources non-jewelry procurement, assembly and after-sale service.

In terms of market development, Pandora entered 41 new geographic areas in the last three years and expanded to new user markets, such as high-end luxury segment with exclusive LovePods collection.
Diversification strategy is mostly beneficial due to three value-creative reasons:
§ Efficiency gains from economies of scope. Pandora realizes economies of scope by utilizing its intangible resources and competences, such as brand and staff skills in design and manufacturing areas. Synergy is created by using the same selling channels and keeping the same marketing expenses;
§ A raise in market power enables to “squeeze” retailers, attain higher margins and negotiate better prices with suppliers;
§ Spreading the risk, which is especially relevant for Pandora due to high dependency on one product. With incorporation of several other products and markets, Pandora could forego, for instance, economic crisis in developed countries or change of buyer’s style.
In addition to Ansoff model, related diversification must be added to separate vertical (backward and forward) and horizontal diversification. Pandora pursues forward diversification strategy by acquiring distribution activities and further increasing its presence in vertical chain. It is not relevant now, but in future Pandora could also step up in unrelated diversification, development of products beyond current capabilities (Johnson, Scholes and Whittington, 2008).
1.2.2.2. The Boston Consulting Group (BCG) matrix
BCG matrix (Henderson, 1979) is one of the best visual tools to evaluate the balance of the different businesses portfolio. Placement of businesses on two dimensions (market share and growth) also reflects the potential demand for investment and different needs to allocate resources.

Pandora – financial and strategic evaluation – master thesis – investorship.uk
To adapt the model to Pandora circumstances, (1) business units are divided into geographical regions and product categories, and (2) present operational status is separated from the direction, where the businesses are moving.
Since the year 2000 Pandora has at least one clear star – charms and charm bracelets. Only in nine years company reached 15%[4] market share of charms and charm bracelet, valued 9.6 bUSD in 2009. Given the same market size, Pandora market share would swing to 26%[5] in 2010 and remain unchanged in 2011. Pandora’s revenue’s from charms grew four times to reach 4.6 bDKK between period 2008-11 and three times from charm bracelets to reach 0.8 bDKK in the same period. In the structure of revenues, these products occupy respectively 70% and 12% of total Pandora revenues in 2011. The success is attributable to the superior concept and overall charms market growth. Between 2000 and 2009, charms and charm bracelets market experienced CAGR +5.8%, while average growth rate of total fine jewelry market grew CAGR +2.9% in period 1999-2009. The downward sloping arrows in the BCG matrix indicate the changes in the second half of 2011, when Pandora’s charms and charm bracelet revenues declined by -13% yoy.
Among Pandora geographical region stars is US market, which contributed 38% of revenues in 2011 and has expanded 3 times from 2008 to 2010 and +0.8% yoy in 2011. As indicated in the BCG model, US market yields even higher share of the total profits and serves as a base for supporting other product categories and geographic regions.
Question mark cell is problematic due to consumption of high investments. The segment is often highly potential (rapid market growth), but is not very profitable (low market share). One clear questionable Pandora business unit is emerging Asia, another – Americas region without US. While most of the main geographical division revenues shrunk, these constituted growth of respectively 2.2 times and +53% in 2011. Consequently, significant investments are projected within emerging countries. The major jewelry market players already have a solid presence in emerging Asia and collect the profits while developed markets stagnate. Another question mark lays on ring product category, which in terms of revenues expanded 3.8 times in 2010, but decreased by -4.5% in 2011. Watches (the first and single non-jewelry product) are the last questionable segment. It is also the only category without indication of direction, since there are no results of the recent start-up.
Cash cows are business units with high market share and mature market. In Pandora these are UK, Germany, other Europe and Australia. These geographical areas have just shifted from stars and are still not very typical “cash cows”. Revenues from these geographical areas increased by respectively 10.8 times, 3.3 times, 3.2 times and 2.6 times in the period 2008-2010, but then suddenly heavily dropped by -4.4%, -6%, -12.7% and -16.5% in 2011. Such fluctuations are dangerous, inflicting also development of question marks.
Other Pandora jewelry products are on the edge of being dogs or question marks, because for a long time they were not able to generate substantial revenues. In 2011 situation remained unchanged – other jewelry sales increased only by +0.2%. Even though BCG model usually suggests divesting or closing ‘dog’ activities, another way is certainly to restructure the business units and try to extract the potential.
1.2.3. Strategic modes
Any of the strategy directions described in Ansoff matrix might be undertaken in different strategic modes: organic development, acquisition or disposal and alliances. Pandora has expanded with organic development and vertical integration acquisitions. Going forward, organic growth should dominate due to several reasons: (1) company’s strength lies in design and manufacturing, which are relatively easily expandable critical success factors. Company could therefore utilize internal design and manufacturing capabilities; (2) spreading investment over time instead of spending at one time with acquisition; (3) Minimizing disruption to current activities to avoid problems with acquisition integration. Pandora has just consolidated distribution companies and significantly increased manufacturing labor force. It would be reasonable to expect a digestion (Johnson, Scholes and Whittington, 2008).
Changing environment could certainly shift strategy to use more mergers and acquisitions: (1) it is a much faster way to change; (2) competitive pressure could influence necessity to acquire or merge with other firms; (3) consolidation synergies with distributors were very material and the same could happen with the retailers; (4) having PE fund as main investor, it is reasonable to expect rapid reaction to opportunities in the financial markets; (5) mergers and acquisitions also open possibilities for exploitation of strategic capabilities, cost efficiency and obtaining new capabilities, for example acquiring other jewelry category or non-jewelry design companies (Johnson, Scholes and Whittington, 2008).
It is increasingly getting popular to share resources and activities with other organizations. Pandora benefits from alliances in form of contractual franchise agreements. Pandora might consider other alliances due to:
§ Co-specialization, allowing each partner to concentrate on the activities that best correspond capabilities. For example, it is useful to consider an alliance when entering new geographical market, where local knowledge of distribution and consumer style is needed. Method proved to be successful when Pandora entered US and Australia markets. Another co-specialization might come with retailers;
§ Learning from partners, for example, taking expertise from partners in developing product categories for non-jewelry products, such as watches and sunglasses. Related reason is experimentation, which could break reliance of current Pandora resources and capabilities (Johnson, Scholes and Whittington, 2008).
The summary of all strategic factors and their implications to value drivers is presented in the appendix 3.24. The actual implications are seen in the valuation result.
[1] Jewelry industry is one of the components of gross domestic product, therefore, the regression functions, where jewelry market is dependent variable y and GDP is explanatory variable x, are designed only to illustrate the general direction, but not to argue about the exact numeric effect.
[2] Historic interest rate is calculated on basis of HICP (harmonized index of consumer prices)- overall index, annual rate of change, neither seasonally nor working day adjusted.
[3] Global market is measured at the market value, Pandora market share is based on 2009 revenues
[4] Market share of 15% is calculated as estimated revenues at retail value. Pandora direct revenues could not be compared with the market size, because Pandora is a wholesaler. Revenues must be compared on a retail basis. Figures are presented by Pandora (2010a).
[5] Market size of 26% is used only for guidance purposes and not as an accurate figure. It is not possible to calculate the accurate figure, because Pandora is a wholesaler and the revenues of Pandora products on retail level are not available. The estimate 26% is made based on 15% market share in 2009, multiplied by 72% growth in sales of Pandora charms and charm bracelets. If to assume that Pandora has not taken the existing market, but rather sold to new customers, then, the market share would have risen to 23% (calculation of 15×1.72/(100+15×0.72))
1. Economic and financial analysis
Company’s value is driven by its ability to earn healthy returns on invested capital[1] (ROIC) and by its ability to grow. Healthy rates of return and growth result in high cash flow, the ultimate source of value (Koller, Goedhart and Wessels, 2010). Pandora’s financial statements are initially reorganized and subsequently compared with main competitor’s accounts.
1.1. Income statement analysis
1.1.1. Income statement reorganization
Reorganization of income statements allows to compute adjusted EBITA, the net operating profit less adjusted taxes (NOPLAT) and income available to investors. NOPLAT is critical and the main ingredient to estimate future cash flows. NOPLAT is available to all financial investors and thus is free from capital structure choice. NOPLAT and income available to investors are calculated from two sides – revenues (“top-down”) and net income (“bottom-up”). Reorganization is displayed in appendixes 4.1 and 4.6 and reconciliation in – 4.7. Adjustments are explained and analyzed in appendix 4.14.
1.1.2. Revenue growth analysis
The reorganization of income statement enables to start the inspection of elements. One of the most important elements and value drivers is revenue growth. Pandora demonstrated an outstanding performance in 2009, 2010 and 1Q 11, but a sudden reverse trend began with 2Q 11 results (see table 4.2-2). After adjusting the sales by currency, portfolio and consolidation effects, Pandora’s organic revenue growth was +69% in 2010, but only +2% in 2011 and -15% yoy in the last quarter of the year.
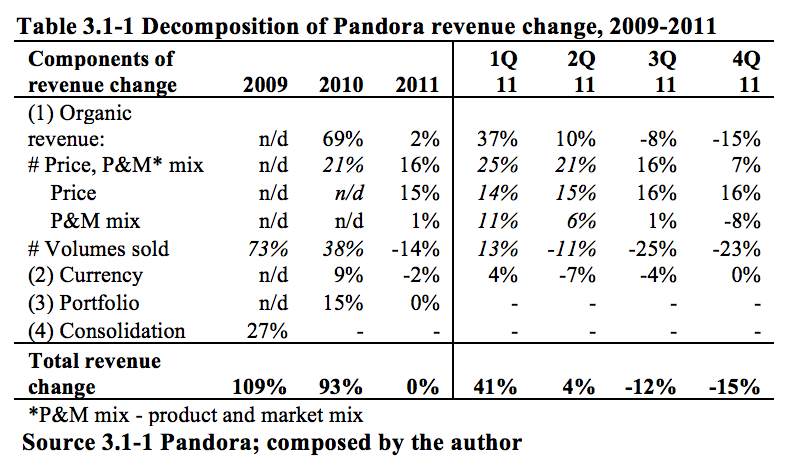
Pandora – financial and strategic evaluation – master thesis – investorship.uk
The decomposition of revenue shows that company constantly and quite significantly increased the prices and at some point this resulted in lower volumes sold. It seems that company reached the point when customers are not ready to pay for affordable jewelry more. As a result, management declared a comeback to the affordable price range and committed no further price increases in 2011-12.
Revenues among different regions show similar trend, but high variability. Revenues from all geographical areas were rapidly expanding before 1Q 2011, but most of the regions shrunk in 2-4Q 2011. What is more worrisome, the trend is still downward sloping. Pandora ‘star’ area US has dropped by -15% yoy in the last quarter of 2011, the highest negative rate in a year. The same happened in Australia, where revenues decreased by -28% yoy in the last quarter of 2011. Some recovery was seen in UK and Germany.

Pandora – financial and strategic evaluation – master thesis – investorship.uk
The overall neutral result was sustained only due to new markets, hiding under line “other”. It is important to highlight Asia Pacific excluding Australia region, where sales increased the most. Developed regions could become strong source of growth in the upcoming periods, if Pandora manages to enter BRIC countries with the same success, as in developed regions.

Pandora – financial and strategic evaluation – master thesis – investorship.uk
An overview of peer exposure to Asia excluding Japan region shows that sales from China, India and other emerging Asia countries increasingly becomes the main driver of growth. The average exposure on Asia among peers climbed from 21% in 2008 to 30% in 2010, comparing with only 2% in Pandora. However, management of Pandora has ambitions to expand in Asia in the nearest future.
Another cut of revenues shows that part of the revenue growth in the period 2008-2011 was attributed to a shift from third part to direct distribution model. Direct distribution accounted 45% of total sales in 2008 and 77% in 2011. Movement along the value chain closer to ultimate customer is projected to remain as one of the revenue growth sources.
One of the most significant components of revenue growth was a change of sale channels from unbranded to branded stores. Even though the total number of stores (see appendix 4.17) has changed insignificantly (just +9.2% from 4Q 09 to 4Q 11), structurally the number of branded stores increased by 1622 and number of unbranded stores fell by -716.
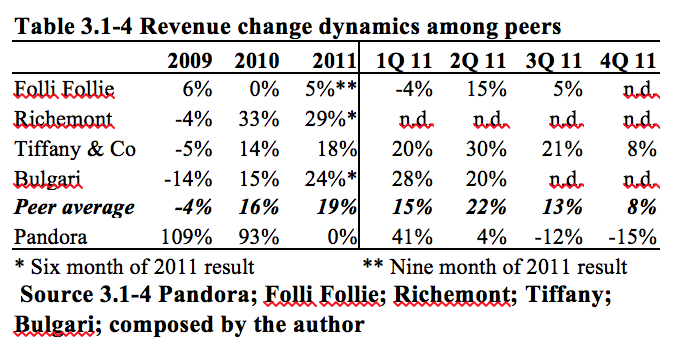
Pandora – financial and strategic evaluation – master thesis – investorship.uk
Revenues per branded store are substantially higher comparing with unbranded stores (4.9 mDKK per Concept store, 1.5 mDKK per SiS and 0.7 mDKK per Gold store comparing with only 0.4 mDKK per Silver and 0.2 mDKK per White store in 2011), thus structural change marked substantial change in revenue size. The credit must be given to the management, who emphasized the structural changes of strategic importance.

Pandora – financial and strategic evaluation – master thesis – investorship.uk
Taking the revenue cut by products, Pandora revenues historically were driven mostly by charms and charm bracelets. Management initiated strategic action to diversify the product range and reduce the dependency over one product. Even though the diversification has been increasing, the pace is very slow and dependency on charms is still risky. Revenues from charms and charm bracelets contributed 82% of revenue in 2011, down only by 4 percentage points from contribution in 2008. The highest progress was made in selling rings, which increased their share in sales from 3% in 2009 to 6% in 2011.
Comparing the overall revenue dynamics with peers, Pandora seems to have quite an individual path, uncorrelated with market movements. While total fine jewelry market grew CAGR +2.9% in the period 1999-2009, Pandora more than doubled sales in 2009 and almost repeated the same growth (+93%) in 2010. The main competitors sold less in 2009, recovered in 2010 and showed further improvements in 2011. On the contrary, Pandora was underperforming peers starting 2Q 2011. Pandora was resilient to luxury sector downturn in economic crisis time, but is turning to negative growth rates in the time, when luxury sector is reviving.

Pandora – financial and strategic evaluation – master thesis – investorship.uk
Pandora was unaffected by economic crisis despite low diversification. Comparing with peers, who had on average 47% exposure on non-jewelry businesses in 2010, Pandora is a very homogenous company. Management intends to diversify the product range by introducing watches and sunglasses. The benefits of diversification are discussed in strategic analysis. To recall one of the strategic conclusions, Pandora has very few synergies with non-jewelry products and therefore, diversification within jewelry category should be placed higher on priority list.
1.1.3. Profitability analysis
Historically, Pandora has demonstrated outstanding profitability comparing with peers. However, Pandora has a short track record and a material influence of structural changes. These two factors together with deteriorating trend poses a question whether margins are long-term sustainable. In fact, financial results of 4Q 2011 and management forecast for 2012 raise concerns of maintenance of superior profitability.
Table 4.2-8 illustrates margin dynamic on three levels. On a gross level Pandora had an impressive 73% margin and a 1200bps lead over peer average in 2011. In terms of operating profit, the lead is even higher – 1400bps in 2011. Despite positive development in gross margin, operating profit margin dropped from 41% in 2009 to only 24% in 4Q 2011 and became equal to operating margin of Tiffany.
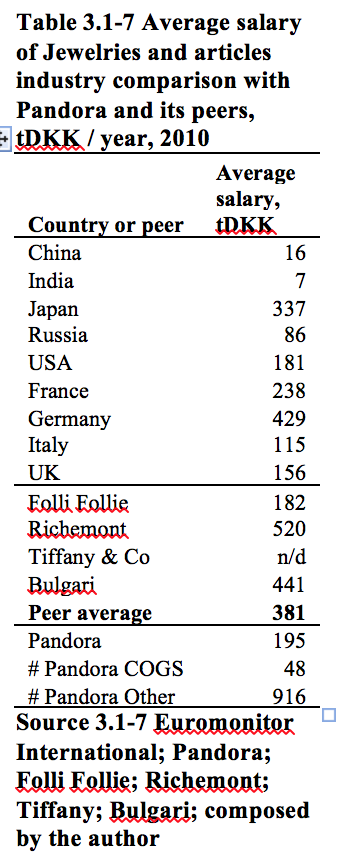
Pandora – financial and strategic evaluation – master thesis – investorship.uk
There are several reasons, why Pandora margins are higher comparing with competitors. First of all, company highly benefited from hedging policies on raw materials. Pandora gross margin would be only 65% or 600bps lower than actual in 2011, if no hedging were used.
Second, gross margins are positively affected by low production staff costs, as described in strategic analysis. Company produces all jewelry in Thailand, where labor supply for jewelry industry is high and cheap. In 2010 Pandora spent 8.9% or 171 mDKK of COGS on direct wages, comparing with 674 mDKK expenses for personnel in administration and distributive functions. Average salary per employee was 48 tDKK per year in production function and 916 tDKK in the rest of the departments. Table 4.2-9 illuminates the differences in wages across developed and emerging countries, Pandora peers and Pandora departments.
There are several remuneration aspects to consider: (1) Pandora has a competitive advantage over peers, who bear higher average salaries; (2) Pandora equally with peers rewards the key management and therefore is able to attract the best professionals; (3) company maintains a flat wage pyramid: relatively few employees receive high salaries and majority is paid relatively low; (4) despite the differences with peers, Pandora production department gets competitive salaries comparing to country average; (5) by utilizing the differences in salaries, Pandora keeps competitive salaries for all employees and is competitive comparing to its peers; (6) the labor switching costs for Pandora are low also because salaries in China and India are much lower comparing with Thailand.
Third, gross margins are driven by centralized state-of-art production facilities in Thailand, an extensive expertise in production and relatively small presence in other than charms product categories. Pandora achieves cost efficiencies, since majority of the revenues comes from a single product and its variations. Peers have lower possibilities to be cost efficient due to a wider product variety.

Pandora – financial and strategic evaluation – master thesis – investorship.uk
Superior operating profit margins are achieved due to impressive gross profitability and lower than peer average selling, general & administrative (SG&A) expenses. In contrast to peers, Pandora does not have retail chain and runs business up to wholesale operations. Generally wholesalers have lower operating expenses, but also much lower prices per unit. Pandora is atypical wholesaler with prices 3.1x of COGS, comparing to a typical jewelry wholesaler’s selling price of 2.1x (see the value chain figure in strategic analysis).
High affordable jewelry industry fragmentation is one of the main factors to explain Pandora’s success. Pandora managed to differentiate from generic producers with successful charm product and “create and combine” concept. Pandora maintains the advantage of high margins by spending significant amounts on marketing, one of the straightforward ways to strengthen the brand.
In terms of marketing expenses, Pandora is significantly over all peers. However, comparison with peers is not exactly appropriate since Pandora is a wholesale business without contribution of retail sales. Taking into account Pandora product sales on retail level, effective marketing expense ratio is lower. In 2010 Pandora typically required multi-brand retailers in US to spend 2.5% of sales on marketing and company itself added an equal corresponding amount of 2.5% (totally 5% from retail sales), comparing with 4-6% of marketing expenditures for an independent jewelry store (Pandora, 2010a). For branded stores, third party distributors are required to spend a minimum 8% of their net sales (in the US, the required minimum spend is typically 4% of annual gross sales), with again corresponding amount from Pandora. In this way Pandora’s expenditures on brand building are approximately half lower than the actual marketing expenses on the brand.
When marketing and SG&A expenses respectively rose to 14% and 43% of revenues, management explained that such level are of temporary nature and will come back to normal levels once the revenues will normalize. Managers expected much higher level of revenues and therefore adequately increased expense. In the longer run, expense ratio was projected to return to the level of 2010. What happened in fact, expense ratio dropped in 3Q 2011, but again skyrocketed in 4Q 2011.
In the strategic analysis pricing power was excluded to be an important factor to influence high margins. Even though Pandora is within affordable price category and has no retailing operations and thus no direct contact with ultimate users, Pandora has relatively strong bargaining power with direct customers, retailers. However, the bargaining power is not endless and Pandora reached the borderline, when additional price increases caused volume reductions.

Pandora – financial and strategic evaluation – master thesis – investorship.uk
Vertical analysis (appendix 4.10) shows that financial and tax expenses combined account for 10% of revenues. Financial expenses consist of exchange losses (2.9% of revenues), interest expenses (1.3%) and other financial costs (0.7%):
· Exchange rate direction (profit or losses) is hardly predictable due to many currencies and dynamic cash flows that Pandora deals with;
· Interest expenses have been decreasing together with financial deleveraging. Pandora was significantly more than peers indebted in 2008 (more details in the balance sheet analysis) and is below average in 2011. With the decrease of leverage, interest coverage ratio[2] increased from 4.4 times in 2008 to 31.9 in 2011. As table 4.3-1 illustrates, Pandora became less risky (only in terms of interest coverage ratio) than peers in 2010;
· Pandora enjoys tax exemptions, which result with the lowest effective corporate tax rate[3] among peers in 2011. Pandora had an effective tax rate of 14%, comparing with peer average of 27%.
Aforementioned factors lead to a very sound net margin of 31% in 2011. What is more important, net margin is three times higher than the peer average in 2010. Looking from the long-term perspective, Pandora margins should converge with the average industry level.
1.2. Balance sheet analysis
1.2.1. Balance sheet reorganization
Before starting to analyze the balance sheet, reported financial accounts are transformed to economic balance sheet. Reorganization (see appendixes 4.2-4.5) is done through series of formulas and adjustments described and assessed in appendix 4.15
1.2.2. Invested capital analysis
The first thing to note about the composition of invested capital is the significant weight of intangibles. Comparing to peer average of 11.5% in 2010, Pandora with ratio of 63.8% has quite different invested capital structure. Significant premium paid for acquisitions is one source of difference and a wholesale type of business, which requires much less capex and inventories comparing to retailing, is another. Taking a dynamic perspective, Pandora’s intangibles’ share shrunk from 87% in 2007 to 64% in 2011. The reason of structural changes is not a reduction of intangibles (as they grew +11% in 2009, +32% in 2010 and +3% in 2011), but a higher growth of tangible assets (+2.3 times, +2.5 times and +3% respectively).
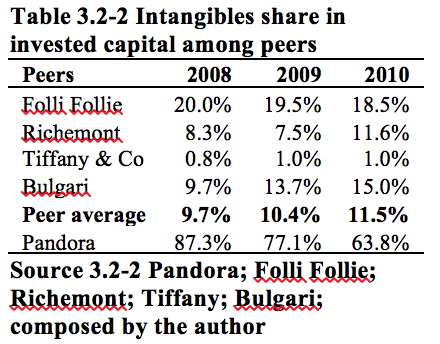
Pandora – financial and strategic evaluation – master thesis – investorship.uk
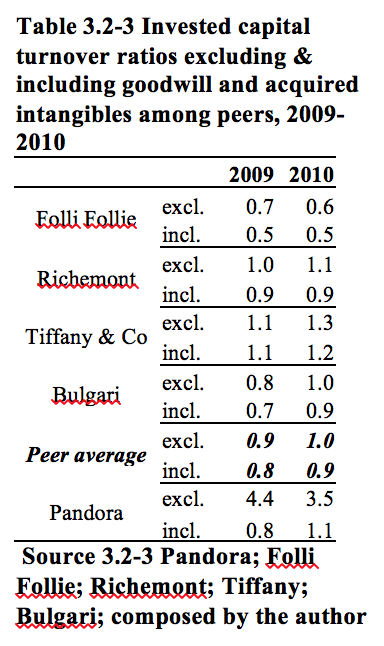
Pandora – financial and strategic evaluation – master thesis – investorship.uk
In terms of invested capital management, Pandora is on average efficient comparing with peers, when counting all invested capital, and is highly above average, when counting only tangible invested capital. In 2011 company had an invested capital turnover ratio[4] of 0.9 excluding intangibles and 2.4 including tangibles. However, capital management efficiency has been declining and the time when peers got more efficient. The difference in efficiency could be again partly explained by the wholesale business specifics, but also by other factors, since Pandora has a superior capital management as a wholesaler. It seems that significant price premiums over acquisitions in 2008 generously paid back in 2009-2011.
Going deeper into tangibles, it is obvious that PP&E plays relatively insignificant role in generating value. In 2011 company hold PP&E only 6% of sales comparing to 20% average peer ratio in 2010. Pandora has more significant operating lease assets (14% of sales in 2011), but they are also lower comparing with peer average of 38% in 2010. It is important to notice, that Pandora prefers to operate under lease agreements rather than to fully acquire the tangible fixed assets.
Even though Pandora’s working capital efficiency has been decreasing over last three years, it is still much above the peer average. In 2011 Pandora had an operating working capital 22% of revenues, while average peer working capital level was 55% in 2010. The breakdown of working capital components shows that Pandora has the highest lead in inventory efficiency (22% in 2011 comparing to peer average of 44% in 2010), is similar with peers in term of trade receivables and has lower than peers trade payables.
Superior inventory management is one of the Pandora competitive advantages over peer:
Pandora – financial and strategic evaluation – master thesis – investorship.uk
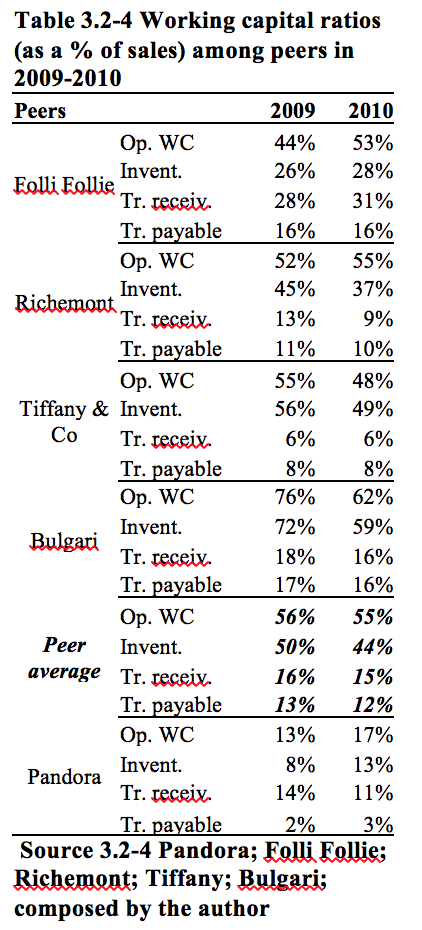
Pandora – financial and strategic evaluation – master thesis – investorship.uk
§ Pandora emphasizes its high inventory return as an integral part of value proposition for retailers. In US Pandora promises inventory turn from 3 to 4 times per year, while independent jewelry store has only 1 turn;
§ High inventory rates are related with specifics of the main product (charms) and its concept (“combine and create”), leading to relatively many returning customers;
§ The trend of inventories ratio is negative: inventory level rose from 8% in 2009 to 22% in 2011. Pandora management explains that the reasons could be broken down into four factors: (1) increased gold and silver prices, (2) lower than expected revenue, not adjusting production output accordingly, and (3) an increase in inventory of POS materials (fixture, print, packaging), resulting from timing and (4) delay in store roll-out plan.
Pandora – financial and strategic evaluation – master thesis – investorship.uk
Liquidity ratio table shows that Pandora chooses efficiency of its current assets over liquidity and ability to meet short-term creditor’s demand. Company’s current ratio dropped from 2.2 in 2009 to 1.8 in 2011 and is significantly below peer average of 3.1. A rule of thumb says that current ratio of two is acceptable and a ratio below one could indicate problems meeting short-term obligations. Since Pandora is generating substantial cash flows and is not highly financially leveraged, liquidity ratio of 1.8 is a positive characteristic. Company also keeps lower liquid assets over current liabilities ratio (0.8 vs. peer average of 1.4) and cash over current liabilities ratio (0.1 vs. 0.5).
Financial leverage is evaluated through two ratios: adjusted net debt to equity (D/E)[5] and adjusted net debt to EBITDA (D/EBITDA)[6]. In terms of first ratio, Pandora was significantly overleveraged comparing with peers in 2008 and is underleveraged in 2011 with a ratio of 0.3. It is important to stress that three players (Richemont, Tiffany and Bulgari) had vey low debt levels and only Folli Follie was overleveraged. In addition, all four peers have been reducing the debt in the period 2008-10.
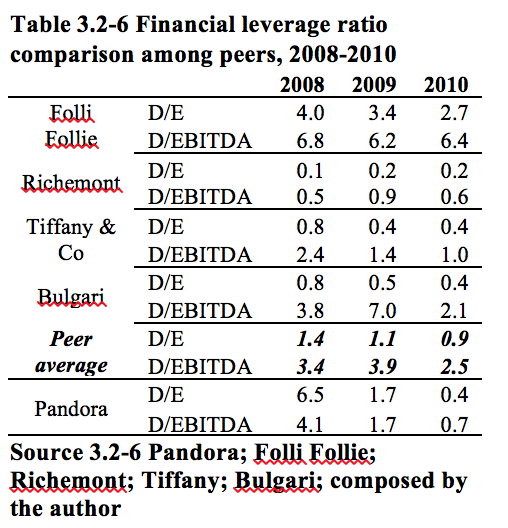
Pandora – financial and strategic evaluation – master thesis – investorship.uk
Second ratio (D/EBITDA) measures ability to service debt in the short-term and is especially useful to get insight when companies use large amounts of convertibles or low interest short-term debt and might have difficulties to roll over their debt under the same low interest. Pandora was again overleveraged in 2008 and got significantly better in 2011, with ratio declining to 0.7, versus peer level of 2.3 in 2010.
1.3. Cash flow statement analysis
1.3.1. Cash flow statement reorganization
It is important to note that reorganized Pandora cash flow statements (appendixes 4.8, 4.9 and 4.16) are substantially inconsistent with reported actual cash flows. Reorganized cash flow statement marks the economic cash flow, which is needed to estimate future cash flows, rather than focus on actual cash flow. The historical discrepancy with the reported cash flow comes due to acquisitions of distributors in 2010 and 2009. Pandora acquired companies by combining assets, which resulted in spending insignificant amounts of actual cash flows, but increasing significantly the asset value. In addition, reorganized free cash flows vary due to inclusion of implicit capitalized operating leases.
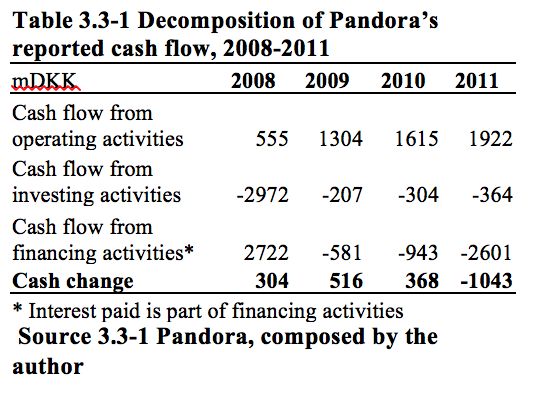
Pandora – financial and strategic evaluation – master thesis – investorship.uk
1.3.2. Decomposition of cash flows
Decomposed in three components, reported cash flows shows how in fact Pandora was managing in the last few years. Significant investment in 2008 boosted operating cash flows by 2.3 times in 2009, further +24% increase in 2010 and another +19% in 2011. Investments in 2008 were mainly financed with the help of creditors. Pandora repaid its debts quick – with 4.2 bDKK cash outflow in last three years.
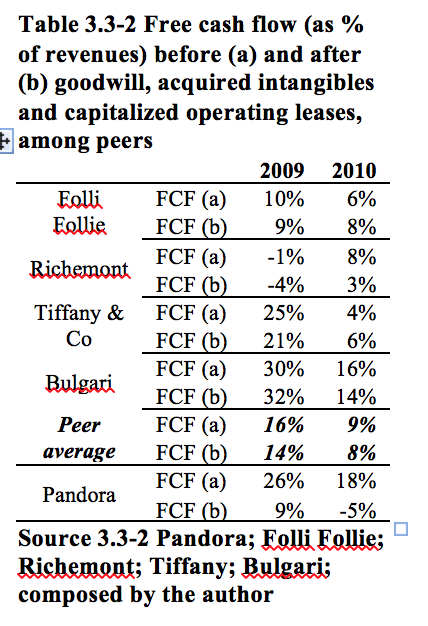
Pandora – financial and strategic evaluation – master thesis – investorship.uk
The largest part of investments in 2008 is attributable to intangible assets. It is vital to emphasize that investments in intangibles carry large portion of the non-cash element. The difference is particularly visible in 2010, when reported cash flow from investing activities equals -304 mDKK, while investments in goodwill and acquired intangibles alone constitute -1173 mDKK.
Pandora generated twice more free cash flow comparing with peers (18% versus 9% of revenues), when investment in goodwill, acquired intangibles and capitalized operating leases are excluded (see the table 4.4-3). The opposite is true when free cash flow is calculated after investment in goodwill, acquired intangibles and change in capitalized operating leases – Pandora had negative cash flow 5% versus an average of 11%.
1.4. Combinative financial analysis
Return on invested capital (ROIC) is one of the three key value drivers. The higher is the ROIC and the longer company is able to sustain higher ROIC, the better is the valuation of the business. ROIC is tightly influenced by every strategic and investment decision and could change due to innovation or favorable market situation. According to McKinsey[7] research, (1) the median ROIC between 1963 and 2008 was around 10% and remained relatively constant throughout the period, (2) ROIC does, however, vary dramatically across companies, with only half of the observed ROICs between 5% and 20%, (3) ROICs differ by industry but not by company size and (4) industries that rely on sustainable competitive advantages tend to have high median ROICs (15 to 20%), whereas companies in basic industries tend to earn low ROICs (5 to 10%) (Koller, Goedhart and Wessels, 2010).
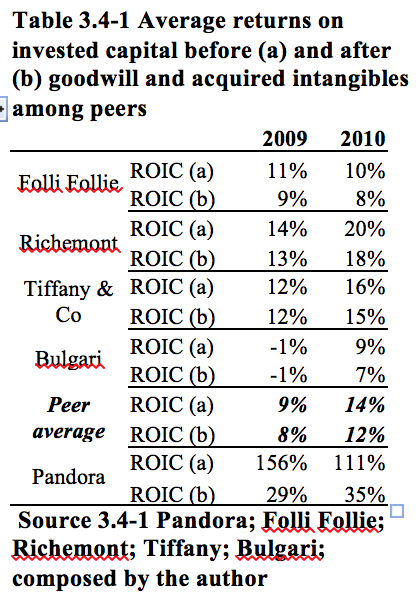
Pandora – financial and strategic evaluation – master thesis – investorship.uk
Pandora has a mix of several factors that lead to the highest ROIC among peers. In 2011 Pandora had ROIC of 24%, comparing with the peer average of 12% in 2010. ROIC was significantly higher (66% in 2011 comparing with peer average of 14% in 2010), when goodwill and acquired intangibles are excluded from invested capital. According to McKinsey definition, Pandora belongs to the group of industries that heavily rely on competitive advantages, such as brands and patents. However, Pandora ROIC has been gradually decreasing and approaching the industry averages. On the opposite, peers were recovering and increasing ROIC after crisis in 2009. Average peer ROIC increased from 8% in 2009 to 12% in 2010. In order to understand the underlying elements that make Pandora to stand out comparing with peers, ROIC is decomposed with four components:

Pandora – financial and strategic evaluation – master thesis – investorship.uk
Decomposition and comparison of ROIC elements (see figure) shows that Pandora’s outstanding performance is attributable not to a single, but several factors: higher gross margin (71% versus 57%), lower SG&A (31% vs. 37%), high working capital efficiency (17% vs. 55%), lower need of fixed assets (12% vs. 53%) and lower operating-cash tax rate (19% vs. 24%). There is only one factor that directly drags Pandora ROIC down – higher premium over book value. However, premium over book is not a weakness, because large amounts of intangibles indirectly influence superior performance in other dimensions.
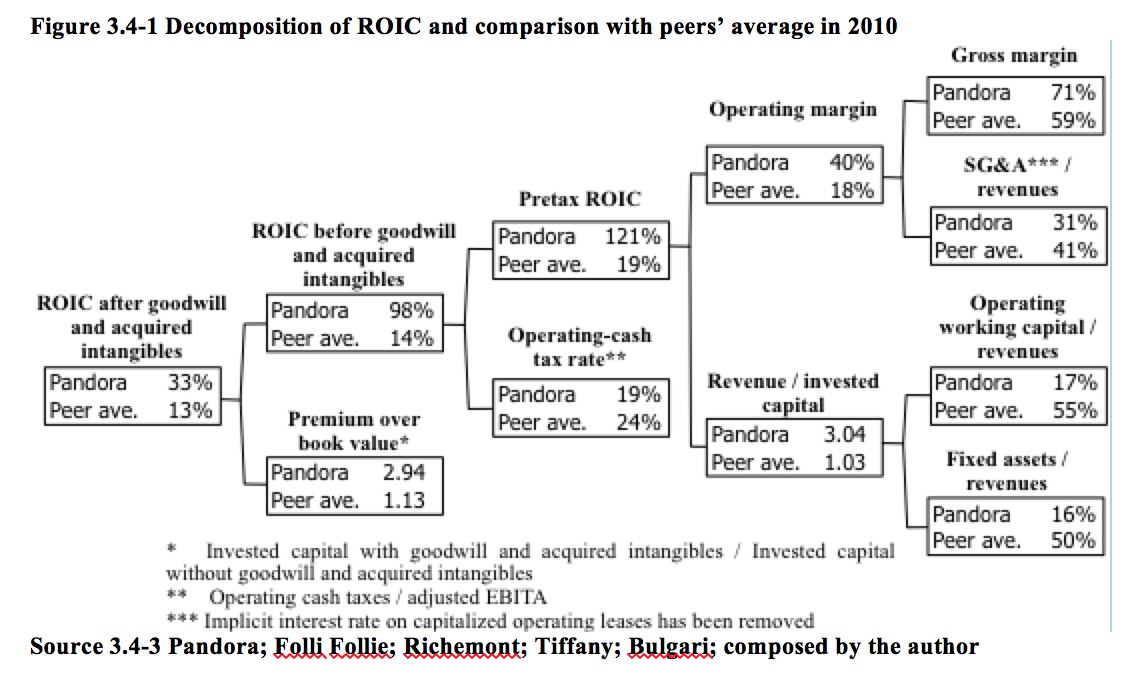
Pandora – financial and strategic evaluation – master thesis – investorship.uk
Substantial ROIC enables Pandora to pay significant dividends to shareholders. After not paying anything in 2008, Pandora distributed 100% of net income in 2009 and 35% in both 2010 and 2011. Comparison with peers reveals that high dividend payout[8] ratio is a common practice. Peers’ average dividend payout ratio fluctuates between 26% and 38% in the period 2008-2010 and Bulgari paid dividends in 2009 despite losses.
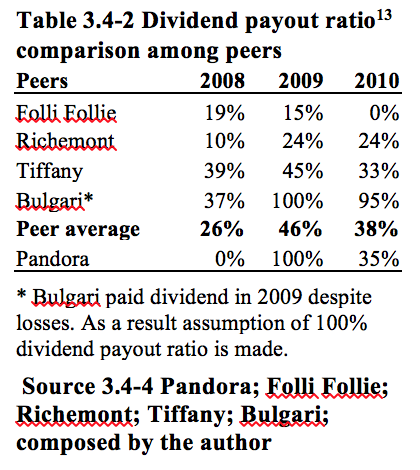
Pandora – financial and strategic evaluation – master thesis – investorship.uk
On the other hand, the higher the dividend payout ratio is, the lower is the retention rate[9]. Pandora had 0% retention rate in 2009 and 65% in 2010 and 2011. Going forward, company promised to retain around 65% of its profits, which is sufficient to maintain high growth rates. In addition, wholesale business concept requires lower capex and allows having higher payoffs to shareholders.
2. Forecast
The forecast is based on the strategic and financial insights that were made in chapters two and three. Although nobody could predict the future, thorough and detailed forecast helps to narrow down possible development paths. The forecasted financial statements enable to estimate NOPLAT, ROIC and FCF, which are subsequently used to determine company’s value.
The forecast is divided into three groups: explicit detailed forecast of nine years, explicit convergence forecast of another ten years and terminal value (perpetuity or steady growth) forecast. Relatively long period is selected to take into account outstanding Pandora historic growth and ambitions to maintain the growth for the upcoming period.
2.1. Forecast of revenues
Revenue growth expectations are based on historical financial performance, paying special attention to recent results, management’s guidance, sector development, economic outlook and four key strategic areas: (1) capitalizing on product offering, (2) building a global brand, (3) focusing on branded sale channels and (4) tailoring approach to new geographical markets.
Pandora’s management guidance for 2012 is more cautious after failing to predict 2011 results. As a result of negative trends, Pandora expects to implement many corrections and calls 2012 a year of transition. Consequently, 2012 revenues (after one-off balancing campaign) are projected not less than 6 bDKK, gross margin – not lower than 60% and EBITDA margin around 25%. Company plans to initiate one-off stock balancing campaign with negative impact on revenue up to 800 mDKK. Gross margins are expected to decline due to rising commodities prices and a reduction in selling prices. Pandora expects capex of around 300 mDKK and an effective tax rate to remain 18%. Company plans to open 200 new concept stores, of which 135 are projected in new markets – Italy, France, Russia and Asia.
Similarly to management forecasts, this thesis projects -3% decrease (to 6.5 bDKK) in revenues, but significantly different profitability levels – gross margin of 49% and EBITDA margin of 11% in 2012. Pandora management indicated considerations to adjust recommended retail prices through better entry prices and promotions and launch a one-off stock rebalancing campaign. This thesis predicts overall price reduction of -15%, which leads to 0% change in selling volume and 1500 bps reduction in gross margin. Revenue decrease is partly offset by entrance to new geographical markets, structural changes within stores (more branded stores) and higher sales in other jewelry and non-jewelry products. Gross margins are projected to decrease further 900 bps due raw materials price increases.
Capitalization on product offering should help to maintain the revenue base, as the popularity of the main product charms and charm bracelets gradually fades out. Projection for the next nine years is based on assumption that growth rate of charms and charm bracelets converges to average market growth, with lower rates in developed countries and higher pace in emerging countries, where popularity of products are expected to come with a time lag.
Pandora has grown to an indisputable leader of charms and charm bracelets market segment with 26% market share worldwide in 2011. The trend change is projected in 2012 and beyond, since jewelry market is characterized by high fragmentation and consumer style variety. Future projections are based on assumption that Pandora looses market share in developed countries and gains market share in emerging countries. This would be enough to maintain absolute revenue growth.
Market of charms and charm bracelets constitutes around 6.6% of total fine jewelry market, comparing to 81% proportion in Pandora sales structure. It is expected that by 2020 proportion of charms and charm bracelets will stay dominant, but only with 56% weight in total sales. It is not the charms and charm bracelets that will decline in absolute amounts, but other product categories will grow at the higher pace.
Charms and charm bracelets are expected to remain dominant due to successful concept “create & combine” attached. Concept allows customers to build personal jewelry, change it over time by adding different charms and drives repetitive purchases. It is expected that old customer will return to add new charms on old bracelets, increasing the charms revenues over charm bracelets revenues from 5.9 in 2011 to 7.1 in 2020. The potential is even higher, since bracelets has capacity to contain 25 charms. Concept “create & combine” attracts customers by low price entrance levels (one charm bracelet and one charm initially) and abilities to allocate spending (and update style) over time. It is a hidden price differentiation, allowing customers to start with affordable prices and reach luxury price segment afterwards.
It is expected that Pandora will significantly increase sales of charms and charm bracelets in the emerging countries, especially Asia, where currently exposure is minimal. It is assumed that the popularity of charms in developed countries with a time lag gradually moves to emerging countries.
The proportion of other jewelry products (appendix 5.1) in total revenues is expected to widen from 18.5% in 2011 to 41% by 2020. The product diversification is expected due to several reasons: (1) payback from extensive assortment of jewelry designs (1800) and high yearly renewal rate (14%), (2) brand driven purchases due to extensive marketing expenses (both Pandora and retailers) and resulting high brand awareness, (3) positive experience migration from charms and charm bracelets to other products, (4) market of other jewelries, such as rings and earrings, is significantly larger comparing with charms and charm bracelets and (5) strategic focus on product range diversification.
Rings contribution in total revenues should more than double by the 2020, converging with the global fine jewelry structure. The forecast is supported by high recent growth rates and rings’ dominant share in total jewelry market.
In terms of new product category development, only 4.5% of total sales are expected to come from other than jewelry products by 2020. Pandora has neither competence, nor competitive advantage to produce other products. There are no visible synergies with current jewelry production and only wholesale operations could add extra value if products are distributed through the same channels. The only strong justification to enter non-jewelry categories is to benefit from brand awareness and with that related quality and image perception. Other jewelries are expected to be outsources similarly to watches and sunglasses.
Watches alone are expected to contribute 1-2% of sales in 2020. This conservative outlook is made with reference to Tiffany example, when watches’ share in total revenues has been decreasing and is currently insignificant. In 2008, 2009 and 2010 watches sales constituted respectively 2%, 1% and 1% of total Tiffany sales. Tiffany signed 20 years license and distribution agreement with The Swatch group to sell Tiffany branded watches.
The diversification in non-jewelries is a very common practice in other large jewelry companies and Pandora might be tempted to follow the path. Diversification is also seen as a risk reduction tool by investors. Despite this, Pandora has stated intention to capitalize on already existing product range. It makes more sense to reduce dependency on charms by expanding to other jewelry product groups, rather than expanding in non-jewelry products, where company has no tangible competence.
Strategy to build a global brand should primarily help collecting revenues from other jewelry and non-jewelry products. Brand image is also important for entering new markets. Branding should help to differentiate from other market players and maintain a price premium. With branding Pandora increases bargaining power with retailers and barriers to enter the segment for competitors.
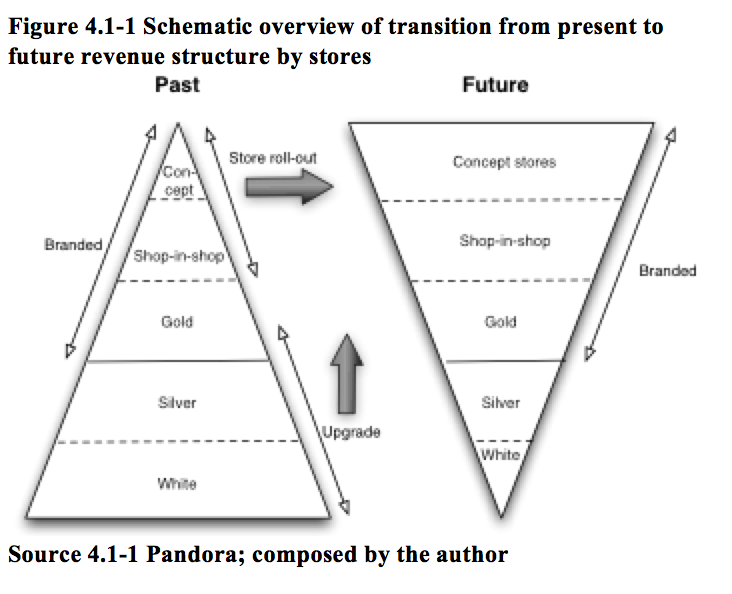
Pandora – financial and strategic evaluation – master thesis – investorship.uk
Global branding should help developing another strategic direction – switching from unbranded to branded sales channels. It is expected that by 2020 Pandora branded sales will account for 90% of total sales, comparing to 79% at the end of 2011. Already two years ago company’s management set a goal to reverse the pyramid of revenues upside down (see figure) – instead of having the highest portion of revenues coming from unbranded stores, company aimed the branded stores to be the primary source of revenues.
The goal is consistent with the overall jewelry market movement dynamics, only that the transition in Pandora is faster. Global branded fine jewelry market accounts still only for 19% of total market, comparing with 60%, 50% and 38% for respective markets for watches, leather goods and eyewear. Transition to branded sales enables Pandora to differentiate and gain competitive advantage comparing with fragmented unbranded players.
While the revenue pyramid is expected to change in shape and size (appendix 5.2), the number of stores distribution pyramid is projected to become only slightly steeper (appendix 5.3). It is anticipated that by 2020 Pandora will have 566 net openings, which gives an annual growth rate of only +0.6%.
The proportion of unbranded POS is forecasted to decrease from 66% in 2011 to 42% in 2020. White level stores are supposed to disappear due to either closure (30% of all stores) or upgrade to the higher level (60% upgrade to Silver level and 10% to branded Gold level). Number of Silver level stores is expected to increase initially, as the upgrades from White level retailers surpass the decreases due to upgrades for Gold level stores, and decrease later, when upgrades from White level disappears.
The rate of upgrades from Silver to Gold level stores is expected to be only 2%, since many retailers prefer to stay independent and offer a variety of other products. Even though Pandora revenues per store at Gold level are 2.1 times higher comparing to revenues at Silver level, retailers would not upgrade their store due to more constrains and regulations from Pandora and two times higher need for investment. The proposal to upgrade store is much more attractive for the White level retailers, since revenues at Silver level are on average 3.1 times higher than at While level and requires only 51% higher investment. Going up the ladder of store levels, the need for investments increases at a higher rate comparing with the increase in revenues.
The number of Gold level multibrand stores is projected to increase every year and enlarge from 14% to 26% of total number of POS. The raise is expected due to upgrades from unbranded stores. Concept and Shops-in-Shops level stores will be the primary source of expansion to new markets. Pandora management believes that company reached high enough level of the brand awareness to start entering markets with branded sales.
The structural store shift (from unbranded to branded stores) is the key revenue growth driver, since revenues per store is significantly higher on branded level. The magnitude of change could be illustrated with a single fact that average revenue at Concept store is 45 times higher comparing with the average revenue at White store in 2011.
Pandora has already proved abilities to expand to new markets with a tailored approach. Future expectations are also built on further expansion to new regions, but the growth rates are expected to significantly slow down (appendix 5.4):
§ Company so far successfully expanded into the developed markets and has basically no experience and no success track record in doing business in emerging countries;
§ Pandora has not yet entered the luxury and fashion centers France and Italy and is thus not acclaimed by fashion industry experts. Specialized in mass production of charms and charm bracelets might not bring acceptance from demanding French and Italian customers;
§ Company entered US and Australia markets in a decentralized way, consolidating assets only afterward. It is therefore questionable, whether Pandora will manage to do equally successful with largely centralized approach;
§ Lastly, Pandora managers intend mainly to enter with Concept and SiS stores, whereas before, entrance was marked with mostly unbranded POS.
Forecast is also split into three geographical regions (appendix 5.5). By 2020 Americas region is expected to be still the second in terms of number of POS, but fall to second place in terms of revenues. Such development is based on Pandora’s priority to enter Asia’s emerging markets instead of emerging South America markets. Meanwhile, US market already contributes the highest share in revenues and is expected to remain number one country by 2020. Revenues from Americas market are expected to grow +4.7% CAGR 2012-20. Americas region could be characterized by higher than Europe revenues per POS and smaller sales volatility. Regional revenues will mostly grow due to net opening of Concept and SiS stores.
By 2020 Europe region is expected to maintain absolute leadership in number of stores, but drop to the third place in terms of revenue contribution. Within European region unbranded Pandora stores constituted 73% in terms of number and only 27% in terms of revenues. Proportion is expected to change to 53% in stores and 20% in revenues by 2020. Revenues per POS are much smaller comparing with Americas and Asia Pacific region due to extensive number of unbranded stores.
Pandora declared aims to focus on Russia, Italy and France markets, which are among largest jewelry markets in Europe. Successful entrance would significantly contribute to sales growth. It is forecasted that Pandora will increase revenues in the region at +4.8% CAGR 2012-20.
Asia Pacific region is expected to be the primary source of revenue growth. Pandora estimated that China has 62 cities, where company could open from 5 to 30 Concept or SiS stores in 3-4 years. Taking an average of 17 stores per city, China alone would add 1054 branded stores openings. Being cautious, estimations are based on 44% openings of potential. Openings are expected to gradually increase in speed, reaching peak in six years. It is expected that 40% of China openings will be done in Concept format and 60% in SiS format. The forecast is consistent with the historical development by competitors. Pandora is expected to erase the gap with peers, who on average have 30% exposure in Asia.
Another very important revenue growth driver is Japan market that is characterized as hardly accessible to luxury players, but one of the largest in size. Pandora’s affordable jewelry collection has potential to be successful in Japan due to similarities to high luxury resistant German, US and Australian markets.
It is forecasted that the growth in Asia Pacific region will constitute +24.6% CAGR 2011-20. The growth will be mainly driven by Japan and China. No growth is forecasted in Australia, which is already one of the most explored markets in Pandora’s radius. Outstanding growth rates are based on rapid region economical development. Eurostat (2012) forecasts region’s nominal GDP growth at +7.8% from 2011 to 2020.
Under this scenario, Asia Pacific region is expected to climb to the first place in terms of Pandora revenues contribution (42% of total), but remain the last one in terms of number of POS (18% of total) by 2020.
2.2. Forecast of profitability
Pandora is expected to loose superior gross margins starting from 2012. Company has managed to widen gross margin to 73% in 2011, but large portion (800bps) represents the gains from hedging raw material prices. Even though raw material prices are projected to drop by -5% in 2012, it will still mean 36% price hike for Pandora and an effective 900bps cut in gross margin.
Raw material price hike is expected due to hedging policies. Pandora has already hedged prices for most of the raw material supply in 2012. Gold is hedged at +20% higher price and silver is hedged at +36% higher price. Silver is taken as a representative raw material price indicator, since company mostly uses affordable price range materials. According to Pandora (2012a) estimates, gross margin is impacted by 2.5% with 10% deviation in average gold and silver price.
Gross margins are also expected to decline due to lower product prices in order to keep the volume stable. 2012 projections are based on -15% price reduction, resulting in another gross margin cut of 1500bps.
Going forward, silver price is forecasted to decline by -25% in 2013. Given the same raw material price sensitivity and no hedging agreements, price reduction would create +620bps higher gross margin. Hedging policies (assumption that prices will be hedged at 2012 level) should postpone the gain and enable to increase the margin only by +60bps.
Commodity price decline should inevitably create pressure for jewelry product sellers to cut their prices and share the benefit with the customers. It is easier to adjust prices for the firms without hedges and more difficult for the firms that use hedge instruments. It is projected that Pandora will resist to pressure by average price decrease only of 2%.
Gross margin revitalization is expected in 2014, when company would benefit from commodity price decrease in 2013. Even though raw material prices are expected to decrease 26% in 2014, hedging policy would not allow exploiting the gain in the present year. Gross margin is expected to increase by 620bps due to decline in raw material price, but also decrease by 320bps due to product price decrease following pressure from competitors and customers. Product price reduction is estimated as a sum of 1/4 theoretical savings if no hedge was applied on raw materials in 2013 (6.2% / 4 = 1.6%) and 1/4 of analogous savings in 2014 (6.5% / 4 = 1.6%). Future forecast is based on assumption that commodity price savings are shared equally between customers and Pandora. However, customers get their share distributed over the two years.
Commodity prices are expected to drop in 2015, slightly increase in 2016 and remain unchanged from 2017 to 2020. As a result of raw material price decreases and equal split of benefit with the customer, Pandora is expected to lift the gross margin to 55% in 2015 and to 58% in 2016. Gross margin is expected to stabilize at 57%, similar profitability level to peer average.
No gross margin variation is projected due to compensation for employees in production. Even though Pandora employees involved in production (mostly in Thailand) are underpaid comparing to the rest of Pandora employees, they are still paid above Thailand salary average and much above countries like India or China. Salaries are expected to change in accordance with revenue changes.

Pandora – financial and strategic evaluation – master thesis – investorship.uk
Selling, general and administration (SG&A) expenses are expected to be controlled better comparing to the three years trend, since the historical increase is largely attributable to over expectation for revenue increase. SG&A expenses are expected to normalize at 36%, which is 600bps better than peer average.
Significant SG&A expense variation among geographical regions (see the table) should diminish and converge, but still be different in the explicit forecast period. European region operating expenses should be higher due to market fragmentation and high investments in France, Italy and Russia. Asia Pacific region should be less cost efficient due to high expansion costs. Americas region should keep the SG&A expense advantage of 1600bps over European market and 1500bps over Asian market in 2012. The Americas region cost advantage is projected to diminish to 400bps over European and 300bps over Asian market by 2020. So far the most efficient market is UK, where SG&A together with D&A constituted 18.7% of revenues. It is forecasted that total SG&A expenses with D&A will normalize at 38% level by 2020, which is lower than 42% peer average in 2011.
Depreciation is expected to have a constant ratio of 17% from PP&E over the forecasted period. Depreciation ratio projection is based on 2011 ratio[10]. Forecast driver of PP&E one year back is chosen due to lower volatility comparing with revenues. Comparing with peers, Pandora is expected to maintain higher expense ratio by using the assets with relatively shorter useful life. Only Richemont is similar with 18% depreciation ratio, while other peers fall within interval of 1.4-7.6%. Forecast is based on the average six years asset life (1 / 17% = 6 years). Accounting regulations stipulate that maximum useful life for land and buildings is 20-50 years, for plant and machinery 5 years and for other plant, fixtures and fittings is 3-5 years.
Amortization expenses are projected to be constant of 30 mDKK per year, since only distribution network is left to amortize with straight-line amortization method and expected life of 15 years from the date of acquisition. The forecast is distinct from historical figures, when distribution rights were written down.
Expansion to new markets will require significant marketing expenses that will be still lower comparing to what was spent in 2011, when too high revenues were forecasted and all efforts were employed to save the declining revenues. A forecast of 13% (of revenues) for the next two years is based on average expense ratio of the last two years. Marketing expenses are expected to shrink gradually to 10% by 2020, which is still by 300bps more than spent peers on average in 2011. Higher estimate is based on wholesale business type and other specifics explained in financial analysis.
Combination of revenue, gross and operating expense factors leads to EBITDA margin forecast of 11% in 2012, which is significantly below three past years. EBTDA margin deterioration is expected mainly due to commodity price fluctuations and inability to adjust operating costs adequately. Raw material prices would inflict EBITDA margin to 26% in 2011 if no hedging instruments were used. EBITDA margin recovery is projected in the period 2014-2016. Profitability is expected to recover due to decrease in raw material prices and a better control of operating costs. By 2020 Pandora is expected to have EBITDA margin of 21%, which is slightly above the three-year peer average of 20%.
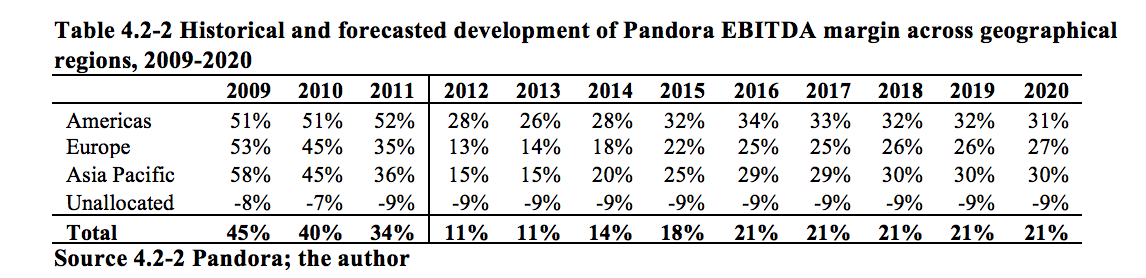
Pandora – financial and strategic evaluation – master thesis – investorship.uk
In terms of geographical regions, the most profitable area should remain to be Americas region, second Asia Pacific and last Europe. EBITDA margin of Americas region is projected to increase from 28% in 2012 to 31% in 2020, Europe should recover from 13% to 27% and Asia Pacific – from 15% to 30%.
Implicit interest expenses on operating lease assets are expected to change at the higher rate than revenues to converge with the peer average. The forecast is based on assumption that the rental expenses to revenues ratio would change from 3.7% in 2012 to 5.2% in 2020. This will result operating leases to revenue ratio changing from 24% in 2012 to 26% in 2020, comparing to peer average of 38% of revenues in 2010. Forecasted capitalized operating expenses are calculated keeping the asset life and cost of debt fixed at respectively 10.9 years and 3.7% level.
Operating cash taxes are forecasted to change in line with EBITA and changes in operating deferred taxes. Operating tax rate is assumed to fluctuate around 18% from 2012 to 2019 and increase to 33% in 2020 and beyond, marking the elimination of tax benefits from Thailand. Operating cash taxes are mainly driven by changes in EBITA, since operating deferred taxes are expected to vary insignificantly.
NOPLAT (appendix 4.6) is expected to decline by -68% in 2012 and gradually recover from up to 2019. Another operating profit drop is expected in 2020, when op. cash taxes are projected to double to 929 mDKK.
Interest income and expenses (analyzed in appendix 5.6) are not part of the NOPLAT or free cash flow and thus have no effect on the valuation through reorganized income statement.
2.3. Forecast of invested capital
Inventory level is projected to continue rising at a slower pace. Company has “lost control” of the inventories, when the inventory ratio[11] skyrocketed from 22% in 2008 to 89% in 2011. Pandora still has an inventory management efficiency lead[12] over peers, but it shrunk from impressive 10100bps in 2008 to 2600bps in 2011[13]. The increase in inventories is explained by soaring commodity prices and delayed effect of adjusting production to lower than expected revenues. However, peers at the same time managed to decrease the average inventory ratio from 123% in 2008 to 116% in 2010. Going forward, inventory level at Pandora is expected to converge with the peer average, reaching 105% by 2020.
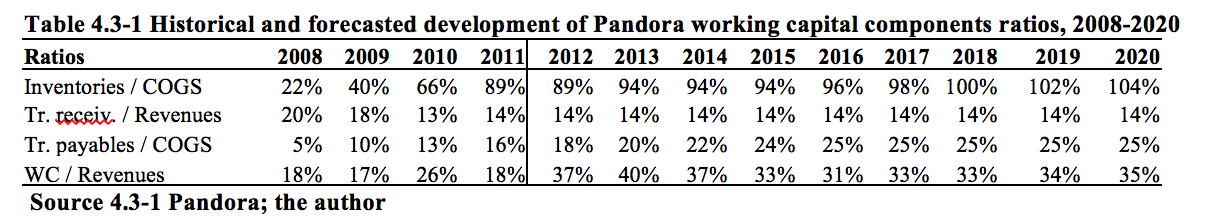
Pandora – financial and strategic evaluation – master thesis – investorship.uk
Contrary to management of inventories, Pandora was successful in gradually cutting trade receivables ratio[14], having a minor rise only in 2011. Future forecast is based on constant trade receivable ratio of 13.5%. Trade receivables are managed better than peers, who had an average trade receivable ratio of 17% in two years.
Trade payable ratio[15] has been gradually rising for the last four years and is expected to continue rising in the next five years period. Pandora has already gained sufficient bargaining power to achieve beneficial terms for trade payables. Company is expected to execute bargaining power and offset increase in inventories. Trade payable ratio is projected to increase to 25% by 2020 that is below peer average of 34% in 2010.
Operating working capital ratio[16] is projected to upsurge in 2012, reach the maximum in 2013, gradually decrease till 2016 and again start rising up to 2020. Even at the peak estimate of 40% in 2013 Pandora had better working capital management ratio than peers, who on average kept 60% of working capital in 2010. One of the primary reasons for advantage is a wholesale business concept. Despite that, working capital is projected to double in 2012 due to mainly soaring raw material prices.
Capital investment forecast for 2012 is based on Pandora’s management guidance of 300 mDKK. The amount equals to 10.2% of estimated revenue in 2012, comparing to 6.2% over the last four years. Additional investments could be linked with the opening of the fifth production facility in Thailand.
Going forward, PP&E to revenue ratio is expected to stabilize for next five years at 10% level and rise to 15% by 2020. Future projection is somewhere in the middle of the lower historical investment level and higher peer average ratio of 20% in 2010. Ratio of 10% reflects Pandora’s target investment level for medium term and 15.2% reflects long-term requirement to sustain growth. Koller, Goedhart and Wessels (2010) suggest that PP&E to revenues tends to be quite stable over long periods.
The forecast exclude the acquisitions and thus investments in goodwill and acquired intangibles. Goodwill, brand, distribution rights and other intangibles are projected to remain constant and distribution network is amortized with a straight-line amortization method. No changes are expected in other long-term liabilities.
Capitalized operating lease assets are expected to increase at a higher rate comparing with revenues to converge the average structure of peers. The capitalized operating lease to revenues ratio is projected to be increase from 18% in 2011 to 26% by 2020.
Invested capital is expected to increase from 7.8 bDKK in 2011 to 16.5 bDKK in 2020. The growth is attributed only to tangible assets, since no acquisitions are expected. Tangible assets are expected to rise by 3.1 times to 11.5 bDKK and constitute 70% of total invested capital. Invested capital forecast from uses side is presented in appendix 4.4 and invested capital from source perspective is displayed in appendix 4.5.
2.4. Forecast of free cash flow
Free cash flow projections are substantially negative for the next two years. Pandora is expected to have severe issues with profitability and the need for high investment to revitalize the operations. First factor leads to lower NOPLAT and second factor demands cash outflow for gross investment. Free cash flow is projected to be -1.2 bDKK in 2012 and -0.4 bDKK in 2013.
The investments are expected to pay back starting from 2014. Net operating profit after tax is projected to double and the need for investments – to halve. Free cash flow is projected to breakthrough to 261 mDKK in 2014 and strongly recover by 908 mDKK in 2015.
The very crucial part of free cash flow volatility is related to changes in working capital. Free cash flow forecast would be positive in 2012 if no working capital changes were anticipated. Another considerable factor pushing FCF down is changes in operating leases. Operating leases are expected to require an annual cash outflow between 229 and 463 mDKK in the period 2012-2019.
Free cash flow (see appendix 4.8) is expected to decrease in the short horizon and gradually increase in the long run. However, free cash flow is not expected to reach 2011 level in the explicit period. Free cash flow is forecasted to reach 1.4 bDKK by 2020, comparing with 1.8 bDKK in 2011.
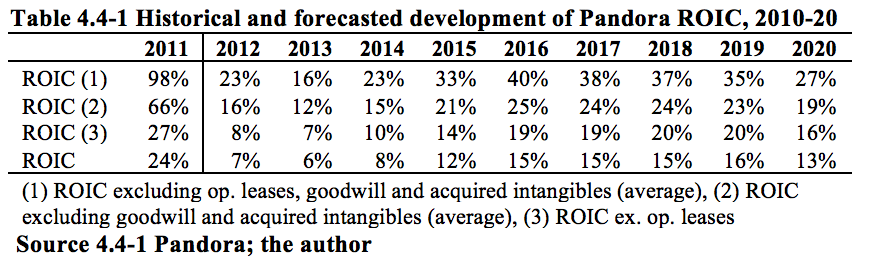
Pandora – financial and strategic evaluation – master thesis – investorship.uk
To sum up, return on invested capital is expected to significantly deteriorate in the nearest future, strengthen later, but never reach historical levels. Future projections are based on elimination of historical superior return on invested capital (24% vs. peer average of 13%) already in 2012. Return is projected to drop further to 6% in 2013. The critical period should end after two years. ROIC is projected to reach 16% in 2019, but then fall to 13% due to elimination of tax benefits.
2.5. Forecast of the steady growth period
The explicit forecast of another ten years is necessary to reach the horizon of steady growth performance. Forecast is based on organic growth, stabilization and convergence with peer average performance indicators. Revenue growth is expected to slow down to average 3.6% and finally land to 3.0% rate in the long run. Adjusted EBITA margin is expected to reach 20% and remain unchanged in the perpetuity period. Invested capital ratios are expected to worsen and converge, but do not fully reach peer average ratios. No more tax benefits are projected in the steady growth period. ROIC is expected to converge to 12% rate, which is more than overall average of 10%, but equal to an average peer ratio. It is assumed that branding and competitive advantages will allow Pandora to achieve ROIC over average and its cost of capital for considerably long term.

Pandora – financial and strategic evaluation – master thesis – investorship.uk
[1] After taxes return on invested capital = Net operating profit less adjusted taxes / Average invested capital
[2] Interest coverage ratio = adjusted EBITA / implicit interest expenses
[3] Effective tax rate = Income tax expenses / Pretax revenues
[4] Invested capital turnover ratio = Revenues / Average invested capital
[5] D/E = (Short and long term debt + Capitalized operating leases – Excess cash) / Equity
[6] D/EBITDA = (Short and long term debt + Capitalized operating leases – Excess cash) / EBITDA
[7] McKinsey & Company’s Corporate Performance Center database, which relies on financial data provided by Standard & Poor’s Compustat made a research of 5000 US-based companies
[8] Dividend payout ratio = Dividends paid in next year / Net income of this year
[9] Retention rate = 1 – Dividend payout ratio
[10] Depreciation ratio equals 17% in 2009. To estimate depreciation ratio, an impairment of 22 mDKK is excluded from total depreciation of 41 mDKK in 2009
[11] Inventory ratio = Inventory / COGS. Ratio is calculated as part of COGS and not sales to avoid distortion of price changes
[12] Inventory management efficiency lead, in bps = (Pandora inventory ratio – peer average inventory ratio)*10000.
[13] Lead in 2011 is calculated taking the peer average inventory ratio in 2010 due to lack of 2011 data.
[14] Trade receivable ratio = Trade receivables / Revenues
[15] Trade payable ratio = Trade payables / COGS. COGS and not sales are chosen to avoid distortion of price changes
[16] Operating working capital ratio = Operating working capital / Revenues
5. Valuation
There are many ways to estimate the value of the company, but the most preferable is the enterprise discounted cash flow (DCF) value driver model, since it relies on cash flows out and in the company, contrary to the accounting-based earnings. Another useful way to estimate the value is to apply economic profit model, which also relies on the cash flows, but puts more emphasis on when company creates the value and how the value is created with reference to economic theory and competitive strategy. Both models are expected to show the same outcome, since they rely on the same fundamental forecasts and assumptions.
Future income streams are discounted by WACC. Valuation is done with the assumption of the constant indebtedness level, since WACC based models are accurate only when a relatively stable debt to value ratio is maintained. In order to capture the value and estimate the sensitivity of different developments, three scenarios are considered: optimistic, base case and pessimistic.
1.1. Weighted average cost of capital
Weighted average cost of capital denotes the opportunity costs of investment that could be alternatively made in other asset, bearing the same risk level. WACC is necessary to account for two effects – time and risk. Discount factor must embody mixed risk to all investors, since enterprise valuation includes free cash flows to all investors. For company that is financed by debt and equity, WACC is calculated as:
Pandora – financial and strategic evaluation – master thesis – investorship.uk
Before moving to separate WACC components, several important issues are considered: (1) WACC equation includes marginal tax rate element, since interest expenses for debt holders create the interest tax shield, which is not included in the FCF calculation, (2) interest tax shields could be also valued as part of FCF, but that would mean capital structure inclusion in the operations and difficulties to compare performance with companies that use different capital structure, (3) WACC understates (overstates) the tax shield value, if Pandora deviates from target debt to value ratio, (4) required rates are based on target market weights and not on historical book values, (5) expectation of inflation is integrated in FCF forecast and cost of capital.
Capital asset pricing model[1] (CAPM) is applied to estimate the cost of equity. Model presumes that expected rate of return for individual security, adjusted by systematic risk (beta coefficient), equals to the market reward to risk ratio. The relationship is linear and could be formulated as:

Pandora – financial and strategic evaluation – master thesis – investorship.uk
In order to apply theoretical model in practice, several assumptions and adjustments are needed: (1) the precision of the beta estimation improves when industry’s beta, adjusted for company’s target capital structure, is used instead of company-specific beta. Industry’s beta is a better estimate because it has lower standard error, (2) beta is the only variable in the equation that varies across different companies, whereas expected return on the market and the risk free rate is the same, (3) the precision of the model improves when adding two other components: company-specific premium and liquidity premium. Preceding components enable to capture risk factors that are omitted when estimating beta, (4) risk is defined only as variability comparing with total stock market, (5) risk free rate is measured in two perspectives: as a separate time point estimate and as an integral part of average risk premium over multiple time periods:
Pandora – financial and strategic evaluation – master thesis – investorship.uk
Unfortunately, model does not suggest what the risk free rate is appropriate. According to Koller, Goedhart and Wessels (2010), there should be at least two characteristics – minimal risk and minimal covariance with the market. In addition, inconsistency with inflation rates is avoided by bond denomination in the same currency as cash flows. While recent Greek example illustrates long-term government bonds are not always free of risk, government bonds tend to have very low betas. Denmark’s government bond yield of 10 years is denoted as risk free rate, since cash flows are forecasted in Danish kroner and Denmark is a top credit rating AAA country. Bonds were trading and risk free rate is 1.68% as of 31 December 2011 (Bloomberg, n.d.).
Much more complicated task is to measure market risk premium, the difference between market expected return and risk free rate. There is a common agreement that stocks should outperform bonds over long period, since investors, being risk averse, require premium of investment in stocks over bonds. However, there is no single approach how to calculate the difference.
Future risk premium could be estimated by extrapolating historical returns. According to Koller, Goedhart and Wessels (2010) between 1900 and 2009 US stocks outperformed 10 years US government bonds by 6.1% when averaged arithmetically and 4.0% when averaged geometrically. Arithmetic average is higher due to volatility in returns. Arithmetic average return measures the mean of the series of annual returns and geometric average looks at the compounded return (detailed comparison in appendix 6.1).
Regression with current financial ratios, such as dividend to price ratio is another method. Different forms of measurement suggest a range between 4.5% and 5.5% for US market (Damodaran, 2011). Market risk premium could be estimated with forward-looking or implied models, such as dividend to price ratio plus growth or cash flows to price plus growth. Based on one of the cash flow to price modifications[2], an estimate of average risk premium between 1962 and 2008 in US was 5.4% (Koller, Goedhart and Wessels, 2010). By other calculations (Damodaran, 2012), implied market risk premium on a cash flow basis was 6.0% in January 2012.
Another approach to estimate premiums is to survey investors about their expectations. For instance, BofA Merrill Lynch Global Research (2011) survey of 287 institutional investors revealed an average equity risk premium of 3.86% as of January 2011.
Getting deeper into the first methodology, Dimson, Marsh and Staunton (2011) in the most comprehensive research of 19 markets and 110 years (between 1900 and 2010) estimated that average risk premium of stocks over long term government bonds equals 3.8% when taken geometric mean and 5.0% when taken arithmetic mean. For Denmark estimates stand respectively 2% and 3.4%, for US – respectively 4.4% and 6.4%. The very serious problem of the estimates is high standard deviation. Standard deviation for total market risk premium is as high as 15.5%, meaning that about two thirds of observations are dispersed within one standard deviation (range -11.7% to 19.3%), given assumption of normal distribution[3]. Volatility could be illustrated by following: for the same 19 markets but 10 years period between 2001 and 2010 average risk premium is -4% with geometric average. Adequate Denmark estimation is +0.2% and US estimate is -3.9%.
For this valuation, market risk premium of 4.5% is chosen to reflect following considerations: (1) financial literature suggest to use risk market premium in the range 4.5% to 5.5%, (2) historical long-term average is 3.8 – 5% globally and 2.0 – 3.4% for Denmark, (3) Pandora is a global company (4) investors are expected to demand solid premium over free risk assets in a gloomy economy.
Next CAPM component beta shows how the stock and the market move together. Company’s raw beta is derived from the regression equation:
Pandora – financial and strategic evaluation – master thesis – investorship.uk
Raw beta is measured on a five years period basis to be in line with the suggestions provided by empirical tests of optimal measurement period. Black, Jensen and Scholes (1972) initiated five years rule of thumb in 1972 tests and later Alexander and Chernavy (1980) supported the rule of thumb with more empirical evidence. The later research concludes that four-year and six-year estimation periods performed best but were statistically indistinguishable.
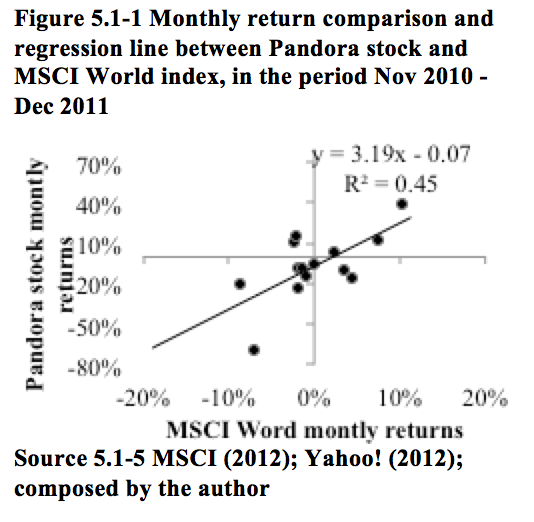
Pandora – financial and strategic evaluation – master thesis – investorship.uk
Raw beta is estimated on a monthly frequency in order to avoid problems with illiquidity. Low liquidity causes the non-trading bias, which arises when the returns in non-trading periods are zero, even though the market may have moved up or down significantly. Non-trading period returns reduce the correlation between stock returns and market returns and thus the beta of the stock (Damodaran, 2011).
Return on the market is equated to return on MSCI World index, which is a value-weighted index comprising large stocks from 23 developed countries. In theory capital asset pricing model should select market portfolio, which includes all assets in the market, held in proportion to their market values. Obviously it is not possible to include the non-tradable assets, but the more widely the index is diversified, the more meaningful beta estimate becomes.
Unfortunately, Pandora has only less than two years of trading history and thus could not be estimated in the optimal five years period. What is more important, beta of less than two years is not reliable to estimate future development. Taking only fourteen months period, Pandora’s raw beta equals to 3.2 and is too volatile comparing with market and peer median of 1.6. Market movements explain only 45% (coefficient of determination) of Pandora’s stock variance.

Pandora – financial and strategic evaluation – master thesis – investorship.uk
Beta estimation precision improves when industry beta is used instead of Pandora’s beta. In order to estimate industry beta, first, raw betas are calculated for each of the peers individually. Surprisingly, three of them (Tiffany, Folli Follie and Richemont) had basically the same beta (range 1.64-1.66) despite different financial leverage ratio and other distinct factors. Visual peers’ stock five-year monthly return dispersions comparing with MSCI World index are displayed in the appendix 6.4.
Beta is a dynamic estimate. Peers’ rolling five-year raw beta development (see the figure) shows significant variability over time. Tiffany has the longest history of the stock trading, dating back to 1988. In this period beta was close to zero and above two. Dynamic analysis shows that beta fluctuations tend to correlate.
Another adjustment is done to remove the leverage effect. According to Modigliani and Miller theory, weighted average risk of financial claims equals the weighted average risk of economic assets. After rearrangements and three assumptions (the appendix 6.5) company’s equity beta equals:
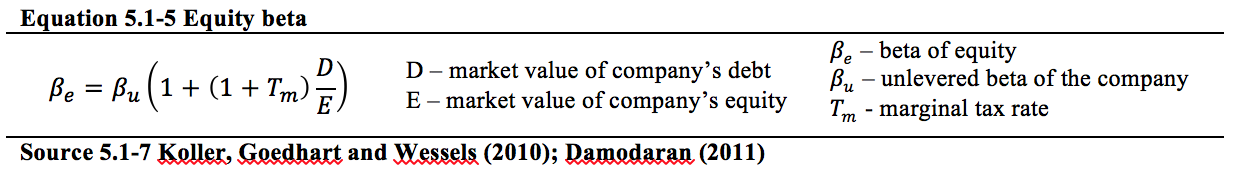
Pandora – financial and strategic evaluation – master thesis – investorship.uk
Leverage and tax adjustments modify the peer median raw beta of 1.64 to median unleveraged beta of 1.20. Beta estimates were similar before and are different after adjustment. The largest adjustment (from 1.65 to 0.84) was made to beta of Folli Follie, which had debt to equity ratio of 129%.

Pandora – financial and strategic evaluation – master thesis – investorship.uk
The peer median unlevered beta is re-levered by Pandora’s target D/E ratio of 18% and marginal tax rate of 25% to estimate the re-levered beta of 1.36.
Beta smoothing is another way to improve estimated betas, especially when sector experiences structural changes (Blume, 1975). Long-term empirical evidence suggests that all betas revert to the mean. Bloomberg methodology suggests assigning 33% weight for one (implied beta of the market) and 67% for raw beta. Pandora’s re-levered beta of 1.36 would turn to 1.24, when smoothing is applied.
Damodaran (n.d.) provides an alternative way to estimate betas by aggregating the data for a whole sector. For 37 US retail companies average beta estimate equals to 1.08 without leverage and 1.29 with leverage (raw beta) as of January 2012. On a global level (sample of 556 companies) beta for retail (special lines) sector was 0.99 without leverage and 1.11 with leverage.
For this valuation raw beta of 1.36 is the most appropriate due to following reasons: (1) it is derived from peer median beta estimates, (2) the estimate is close to Tiffany’s 20 years rolling monthly beta average of 1.39, (3) estimate is close to average beta of one of the most liquid markets retail store sector companies.
Pandora has a zero liquidity premium due to numerous reasons: (1) company is large in size, (2) its shares are traded in the stock exchange and large portion of shares are “free float”, (3) shares are traded very actively, with daily turnover of 2770 in shares and 140.6 mDKK in value from IPO to the end of 2011.
Pandora is assigned 2% company-specific premium due two following reasons – company does not have long and successful track record among global luxury players and is significantly dependent on one product – charms. The existence of additional risk is confirmed by high company’s stock volatility. Company’s raw beta equals 3.2, which is above the median industry beta of 1.2. Some of volatility comes from indebtedness, but certainly there is some additional risk premium to estimate. Over long term, company-specific premium is expected to converge to zero. Given aforementioned assumptions, CAPM leads to cost of equity of:
In order to estimate the cost of debt, it is generally advised to use the yield to maturity of the company’s long term, option-free bonds (Koller, Goedhart and Wessels, 2010). Since Pandora does not have any bond issues, cost of debt could be estimated only indirectly. One of the most widely used methods in practice is a synthetic rating estimation and default spread assignment depending on the synthetic rating. It replicates the process that rating agencies do, when they assign ratings to bonds (Damodaran, 2011).
Before estimating Pandora’s synthetic credit rating it is important to analyze the margins of the present and past credit facilities. In February 2010 Pandora borrowed 2.2 bDKK through a three years maturity senior credit facility, with CIBOR plus margin of 2.5% per annum interest rate. This margin falls in between the rating A- and BBB+, when valuing the yield spreads over US treasuries as of May 2009 (see appendix 6.6). Companies with credit rating A- for three years borrow at average margin of 213bps and companies with rating BBB+ borrow at average margin of 336bps.
Before lending Pandora creditors had an access to financial accounts of 2008 and 2009. One of the most important credit decision factors, interest coverage ratio[4] was respectively 4.4 and 7.0 times. Under these ratios and table provided in the appendix 6.7 Pandora credit rating would be BBB or A respectively.
Since then Pandora has substantially reduced its indebtedness, paying old borrowings back and signing a new agreement of 2.5 bDKK revolving credit facility for three years until March 2014. Agreement allows more flexibility, since Pandora could draw and return credit at any time within three years. Company had drawn significant amounts to refinance old debt in the beginning of agreement, but returned almost all debt in the end of 2011. Unfortunately, Pandora does not disclose conditions and thus interest rates or commitment fees on the facility. Obviously refinancing was made on better terms, since indebtedness decreased and interest coverage ratio stepped up.
Interest coverage ratio is the best medium to estimate the synthetic rating when nether official rating or margins are revealed. Pandora had on average 16.1 interest coverage ratio in the last four years, but 31.9 in 2011. Future four-year estimates are based on average interest coverage ratio of 8.4, falling down to minimum 5.3 in 2013. In January 2012 Pandora would be assigned credit rating of A+ and a long-term margin of 130bps (see the appendix 6.7), given the four-year average interest coverage ratio and rating of A- with spread of 165bps, given the lowest interest coverage ratio of 5.3.
According to another source, companies with credit rating A+ and ten years bond maturity in May 2009 had spread of 139bps and companies with credit rating A- had spread of 177bps (see appendix 6.6). Being cautious and conservative, the spread of 177bps seems to be the most appropriate measure to reflect the long-term risks. The conclusion is supported by the poor recent financial results and pessimistic forecast for the short-term period. By adding risk free rate, cost of debt turns out to be:
Cost of debt needs to be reduced by the tax rate to incorporate the tax shield value created by debt. Whereas operating cash tax rate was used to estimate future cash flows, a marginal tax rate is taken to incorporate the tax shield value for the debt. Pandora’s marginal tax rate is a statutory 25% tax rate in Denmark:
Setting the target capital structure is the last step before estimating WACC. The target capital structure is based on three assumptions: (1) capital structure is measured at the market values, because cost of capital should capture the cost of raising new funds. WACC marks an expected return on alternative investment with identical risk, thus, if the decision was made to return the capital to investors, the debt would be repaid and shares repurchased at the market value, (2) Capital structure is measured at target values, because current capital structure does not reflect the long-term debt to equity ratio and is influenced by short-term share price volatility and (3) short terms deviations from target capital structure should revert back within short time period and on average remain unchanged in the long run.
Pandora shares are traded in the Copenhagen stock exchange, thus market capitalization represents the shareholder’s equity market value. Pandora’s market capitalization was 7.0 bDKK at the end of 2011, which is 30% more than the book value of 5.4 bDKK.
Debt should be also estimated at the market price, but Pandora has no tradable debt. Pandora has a revolving credit facility of 375 mDKK, implicit operating capital leases of 1174 mDKK and excess cash of 43 mDKK at the end of 2011. Revolving credit facility was refinanced less than a year ago (in March 2011) and thus is a sufficiently good proxy of market value. Market value of operating leases is estimated in appendix 4.11 and market value of excess cash equals to book value due to high liquidity.
Target estimate is derived after analysis of three factors: (1) historical and present Pandora’s capital structure, (2) peers’ and sector’s averages and (3) review of management approach.
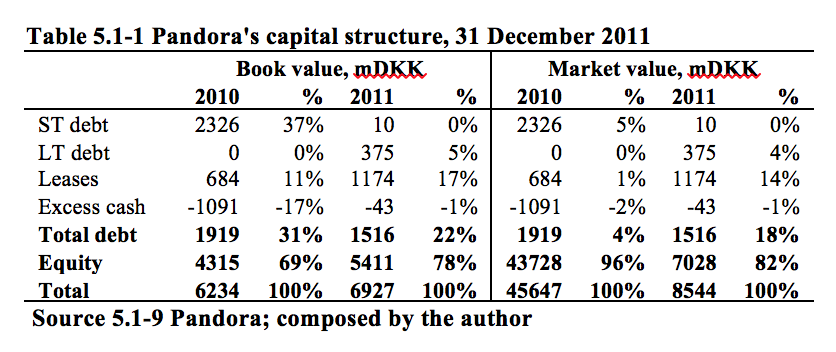
Pandora – financial and strategic evaluation – master thesis – investorship.uk
In the end of 2011 Pandora’s capital consisted of 83% equity and 17% debt (see the table). However, just a year ago the structure was respectively 96% to 4%. The net debt has decreased by -22% in one year, but market capitalization dropped by extraordinary -84%. It would be obviously incorrect to take into account only present or past capital structures, because they rely too heavily on ephemeral investor sentiments. At the same time book value based capital structure fluctuated less – from 69% equity weight in the end of 2010 to 78% equity weight in the end of 2011.
Peer analysis shows that average market capital consisted of 81% equity and 19% debt in 2010, up from 73% and 27% proportion in 2009. The simple average however is heavily skewed by untypical capital structure of Folli Follie. Excluding the latter, average peer capital structure would be 94% and 6% respectively. Jewelry industry is mostly driven by equity, which is a common characteristic for high growth and capital light industries. Taking a broader perspective, global retail (special lines) sector of 556 companies had an average market to debt to capital ratio of 13.45% in January 2012, comparing with 53.1% for all 41083 companies worldwide. In US the retail store sector with 37 firms had and average market debt to capital ratio of 20.4%, comparing with 31.8% for all 5891 companies in US.
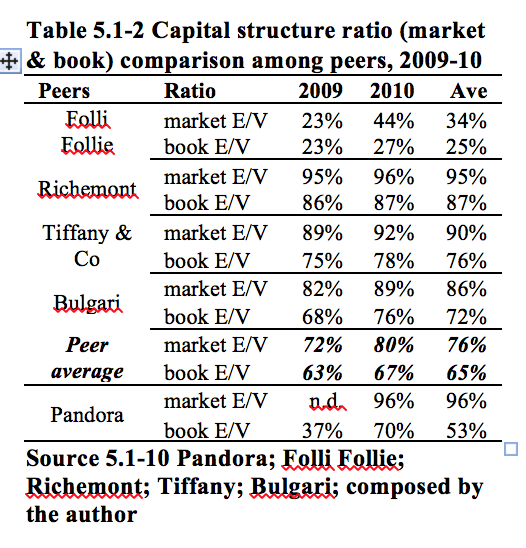
Pandora – financial and strategic evaluation – master thesis – investorship.uk
Pandora has no public statements regarding target debt to equity ratio, but several important factors should be taken into consideration: (1) Pandora is led by private equity firm, which knows the value of leverage and, in fact, heavily used leverage to lend to Pandora in the beginning of acquisition, (2) Pandora has reached sufficiently high market share and solid cash flows to fund further growth only from inner resources. As a result, Pandora returned old debt and signed new flexible revolving credit facility. Besides, Pandora plans to remain a wholesale company, which results in lower (vs. peers) high capital expenditures and thus indebtedness.
After taking into consideration all factors, long-term target capital structure is assumed to consist of 85% equity and 15% debt. Target structure matches the retail store sector average and is half way between Pandora’s 2010 and 2011 capital structures. Target structure assumes higher equity weight comparing with peer average, but is lower if to exclude Folli Follie part. Finally WACC equation could be rewritten as:
1.2. Discounted cash flow model
Conceptually the value of operations (appendix 4.18) equals a sum of present value of FCF during the explicit forecast period and present value of FCF after explicit the forecast period. While explicit forecast was aggregated in previous chapter, an estimation of value must be also done after explicit forecast period.
There are several ways to estimate terminal value, but the following formula is preferable due to direct link with previously analyzed components NOPLAT, growth, ROIC and WACC:
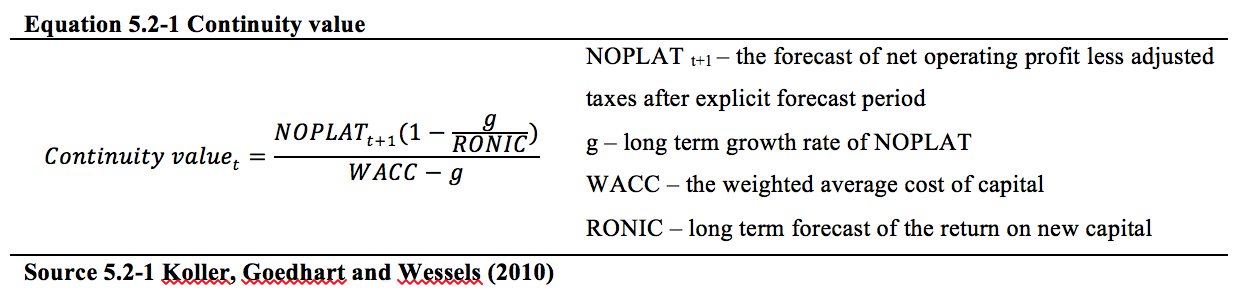
Pandora – financial and strategic evaluation – master thesis – investorship.uk

Pandora – financial and strategic evaluation – master thesis – investorship.uk
The growth in revenues and NOPLAT is expected to be 3% in the long run, given 1.5% volume growth, 1.5% price increases, constant profit margin and an operating cash tax rate of 31%. The growth rate is below the world’s real GDP growth rate forecast of 3.2%[5] and historical 1967-2007 household and personal products industry CAGR, adjusted for inflation, of 4%. The estimate is consistent with the long-term growth observation of 3% in a fully penetrated market and is higher than 1% real growth over 15 years following the entrance to Fortune 50 list (Koller, Goedhart and Wessels, 2010).
The perpetuity period forecast is based on the same target capital structure (85% equity and 15% debt) and unchanged WACC (8.72%). It is expected that long-term return on new invested capital (RONIC) will vary around 12%, which is by 1200bps lower than ROIC in 2011, but by 200bps higher than historical median of US-based nonfinancial companies and equals to peer average in 2010. Higher than average ROIC is based on the fact that industries relying on sustainable competitive advantages tend to have ROICs between 15% and 20%. It is assumed that Pandora, like other branded jewelry companies, owns brands that will allow maintaining returns above its cost of capital in the long run.
Terminal value equals to 40 bDKK at the end of the explicit period and 8.2 bDKK at the present time. Terminal value estimate (52% of total value of operations) is similar to present value of cash flows in explicit period (48% of total value of operations). Significant share of terminal value does not mean that most of the company’s value is created in the terminal value. Pandora is projected to lay fundaments in the explicit period and harvest after explicit period.
Value of operations is adjusted by midyear factor[6] to take into account the fact that cash flow projections are made at the end of the year, while actual cash flows occur throughout all year.

Pandora – financial and strategic evaluation – master thesis – investorship.uk
Enterprise value is calculated as a sum of present value of operations and value of non-operating assets. Enterprise value presents the value available to all investors – equity and debt holders. Pandora had an estimated excess cash of 43 mDKK and non-consolidated investments of 34 mDKK in the end of 2011. Since non-operating assets are of insignificant size (0.5% of total enterprise value), enterprise value of 20.6 bDKK is mainly consists of value of operations.
Two Pandora investors – creditors and shareholders further divide the value of enterprise. After subtracting debt and non-equity claims, value of equity is estimated to be 14.9 bDKK or 115 DKK/share. The estimated fair price is significantly higher than the market price (54.0 DKK/share in the end of 2011), but lower than the IPO price of 210 DKK per share.
1.3. Economic profit model
Economic profit model is an alternative DCF model. Economic profit model shows (1) whether company is earning its cost of capital, (2) how financial performance is expected to change over time in relation to economic theory and competitive strategy. Economic profit could be defined as the excess of NOPLAT over required return of investors (equations provided in appendix 6.8).
Pandora valuation with economic profit model (see table) shows that intrinsic value is basically the same, regardless the method applied. Similar outcome is attained due to the same inputs. Economic profit model highlights three important periods: (1) economic losses within next three years, (2) rapid economic profit generation from 2015 to 2019 and (3) steady economic profit growth after sharp decline (due to losses of tax benefits) in 2020.
Economic profit breakdown shows that the largest part of the value is not anymore created in the terminal value (20% of value). The largest share of value is attributed to outstanding invested capital (49%), which was accumulated in the past. The rest of economic value (31%) is projected within the next 19 years.
1.4. Cash flow model variations
Discounted cash flow model is based on the key value driver formula, because it attaches company’s value with the fundamental value drivers – growth, ROIC and WACC. However, valuation theory suggest many other DCF variations, among them – perpetuity free cash flow, exit multiple and NOPLAT convergence are some of the most popular.
The perpetuity FCF model is the traditional and probably the most popular discounted cash flow variation. Perpetuity model differs from the key value driver model in the way continuity value is estimated[7]. According to perpetuity FCF, Pandora’s value per share equals to 108 DKK.
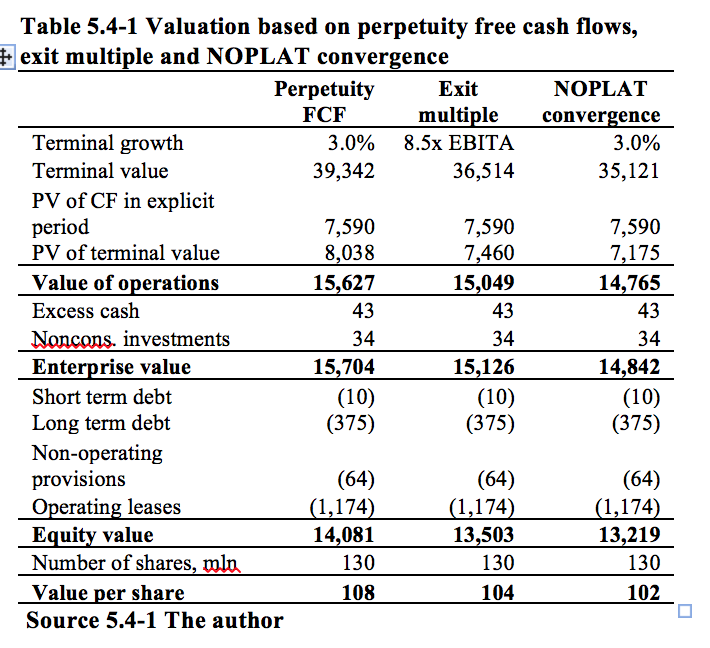
Pandora – financial and strategic evaluation – master thesis – investorship.uk
Valuation based on exit multiple presumes company will be worth the same multiple in the continuity period as at present moment. This variation often leads to inaccurate (and often too optimistic) valuation, since present multiple might change due to different growth and return prospects in future. Exit multiple of the lowest average peer EV/EBITA ratio in three years (8.5 in 2008) is chosen to avoid over-optimism. Even though publicly traded multiples are subject to the problem of ignoring control premium, it avoids the problem to overvalue the control premium and synergies that are relevant only for certain acquisitions. For instance, even though LVMH bought Bulgari shares at the EV/EBITA ratio of 35, it cannot be transferable to Pandora in the long run. Taking the multiple of 8.5, Pandora value per share equals to 104 DKK.
NOPLAT convergence valuation model[8] is based on assumption that RONIC in competitive industries eventually converges with WACC, since all the excess profits are cleared by strong competition. Valuation with this model leads to value of 102 DKK/share.
1.5. Sensitivity analysis
Discounted cash flow models are based on numerous assumptions. Sensitivity analysis is designed to investigate how the changes in inputs affect the valuation.
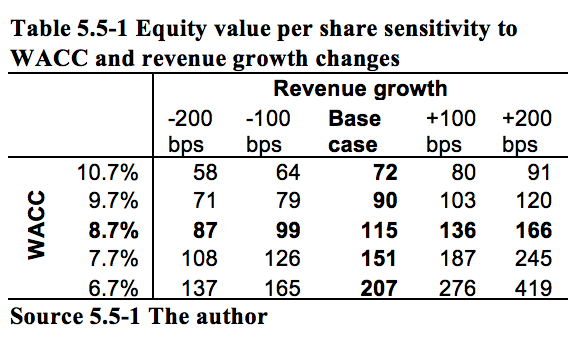
Pandora – financial and strategic evaluation – master thesis – investorship.uk
Weighted average cost of capital is one of the most influential factors. WACC increase by 100bps causes value of equity to decline by -22% or 3.2 bDKK in absolute amount. Consequently, equity value per share drops to 90 DKK. On the opposite side, 100bps reduction in WACC causes value to increase by +31% or 4.7 bDKK. Sensitivity analysis shows that minimal changes in investors’ appetite (required rate of return) cause significant fluctuations in the value. Sensitivity analysis also displays another important characteristic – effect to value change deceleration with the raise of WACC and effect acceleration with the decrease of WACC. Additional increase by 100bps in WACC leads to a value reduction of -20%, but opposite is true for a further reduction in WACC, when 100bps decrease leads to a +37% change in value.
Similarly important is revenue volatility. Value drops by -14%, when revenue growth rate (including terminal value growth) is cut by -100bps and value increases by +18%, when revenue growth is upgraded by +100bps. Consequently, valuation is dependent on how Pandora would manage to enter new markets, particularly Asia Pacific, where revenue growth for the next nine years is projected at CAGR +24.6%.
Valuation changes dramatically, when both WACC and revenue growth changes take place at the same time. Simultaneous WACC increase by +100bps and revenue growth decrease by -100bps leads to value drop by -31% to 79 DKK/share. It is not an unrealistic scenario, since drop in revenue growth rate might mean concurrent escalation of risk. In fact, Pandora have experienced similar situation in August 2011, when share price severely plunged due to decrease in revenue growth expectation and required rate of return. On the positive side, combined -100bps decrease in WACC and +100bps increase in revenue growth leads to +63% growth in value. Taking 200bps change interval, value fluctuates in the range 58-419 DKK.
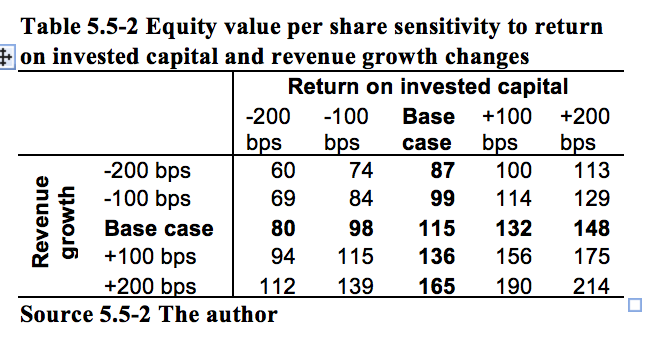
Pandora – financial and strategic evaluation – master thesis – investorship.uk
Valuation is also significantly sensitive to the third value driver – ROIC. Pandora valuation decreases by -15%, when return on invested capital (both ROIC and RONIC) declines by -100bps and valuation rises by +15%, when ROIC and RONIC raise by +100bps.
Valuation is less sensitive to terminal value factors – terminal value growth and RONIC. Even though terminal value contributes 20% of value of operations (measured by economic profit model), it seems that most of the value is accumulated before. Value decreases by -4%, when terminal growth rate decreases by -100bps. Value is affected even less by RONIC changes – a decrease of -100bps causes value reduction by -2%. Combination of the negative effects by 100bps decreases the value by -5%.
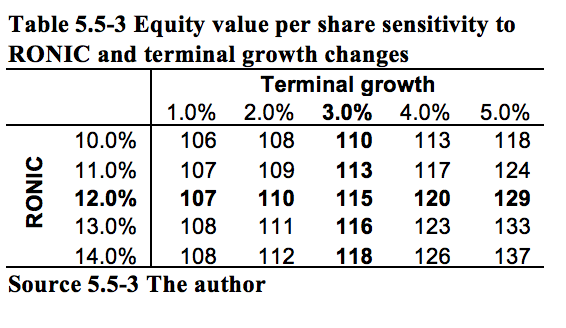
Pandora – financial and strategic evaluation – master thesis – investorship.uk
Another important uncertainty lays in the assumption of the tax rate. Valuation models are subject to two important assumption: Pandora would no longer benefit from Thailand tax exemption after 2019 and operating tax rate is highly influenced by effect of higher foreign tax rates compared with Danish statutory tax rate. The value decreases by -2%, when tax rate is lifted by +100bps.
Sensitivity to target debt to value ratio is lower than it might seem at first glance. The value decreases by -2%, when target debt to value ratio changes from 15% to 10%.
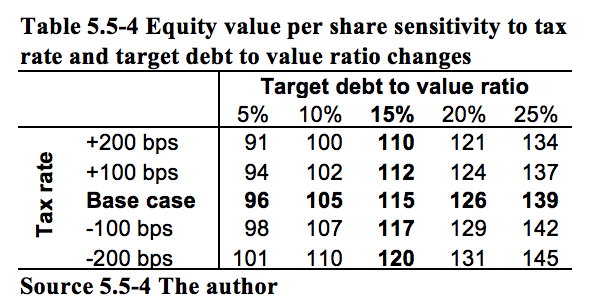
Pandora – financial and strategic evaluation – master thesis – investorship.uk
Finally, valuation changes extraordinarily (-43%), when changes (by 100bps) take place in all three key value drivers.
1.6. Scenario matrix
Sensitivity analysis has limited value, because strategic choices are not isolated by effect on one variable. Therefore, sensitivity analysis provides restricted view of effect, given that everything else stays constant. In reality an increase in prices simultaneously might affect the volume sold due to negative slope of demand or increase the margins due to relatively fixed SG&A costs. The counter effect of price increase is especially important for Pandora, which saw a volume drop at the recent price increase. Hence, it is valuable to estimate different scenarios with sets of changes in many variables. Pessimistic scenario is based on failure to implement key strategic elements:
· Expansion to Asia and especially China fails, because Pandora brand is not recognized and the concept does not fit to emerging countries. Pandora is unable to sell the products in Asia in the same price range, since there it is treated as luxury goods and has insufficient recognition to be sold in luxury segment. This results not only in lower store openings, but also higher SG&A costs due to store operating inefficiencies;
· Revenues from other jewelries increase by less than initially planned. Pandora continues to rely heavily on charms and charm bracelets. Since other jewelries constitute a large portion of growth in the base case scenario, total revenue declines by 200bps in the explicit forecast period;
· The process of opening branded stores and closures of unbranded stores slows down. Company is also unable to generate historical sales per POS in branded stores, since they become of the similar level to other stores. Customers are not willing to pay premium for products in the branded stores, leading to lower overall revenue and higher SG&A;
· As a result of aforementioned factors, 19 year explicit period revenue forecast drops from CAGR +6.4% to CAGR +2.2%;
· Not without consequences, terminal growth is expected to fall by 100bps in the pessimistic scenario, meaning only changes in line of inflation;
· As a result of over-optimism company spends more on operating expenditures, which together with other factors leads to average EBITA margin drop from 19% in the base case scenario to 15% in the pessimistic scenario. The margin is however consistent with average peer level in 2009;
· Lower revenues and corresponding costs also require less invested capital. It is relatively counter balancing the negative effect of revenue and profit margin decrease;
· All in all, the pessimistic scenario leads to DCF valuation of 40 DKK per share.
Optimistic scenario is based on successful strategy application:
· The first and the most likely potential arises from the benefit of decrease in gold, silver and other commodity prices. In the business as usual scenario Pandora is severely affected by hedging policy to buy commodities at agreed higher price and sell products with the price reduction due to competitive pressure. In the optimistic scenario hedging is still affecting the gross margins, but less intensively. In addition, competitive pressure to cut the prices is not as severe, leaving Pandora with a gross margin of 63% by 2030, which is by 500bps more than gross margin in base case scenario and by 500bps more than peer average. The projection is viable since the average 2009-2011 gross margin was 71%;
· In the optimistic scenario Pandora manages its SG&A costs slightly better than in business as usual scenario. The forecast is realistic, since about the same level was kept in 2010 and much more efficiently Pandora managed in 2009;
· Pandora enters new markets with the same success as it entered US, Australia, Germany and UK. As a result, revenue increases in the explicit period by 100bps higher rate than the base case scenario;
· It is assumed that successful development of other products could bring another +50bps additional revenue growth year on year basis in explicit forecast period;
· All in all, the Optimistic scenario brings the DCF estimate of 302 DKK per share.
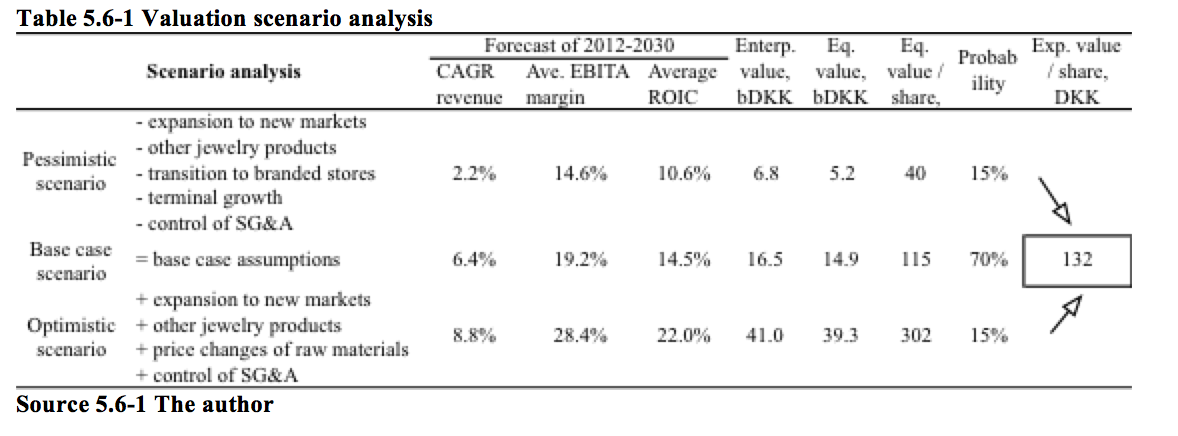
Pandora – financial and strategic evaluation – master thesis – investorship.uk
The likelihood of pessimistic and optimistic scenarios is 15%. The optimistic scenario though offers much higher upside than pessimistic – downside. Consequently, expected value equals to 132 DKK per share.
1.7. Multiples
Valuation on multiples, or relative valuation, is undoubtedly the most popular valuation technique, used much more often than DCF models. The primary advantage of relative valuation is its simplicity and, consequently, the speed to arrive to the valuation result. Multiples are though often misleading, because they rely on short periods and account only for limited effects. Therefore, it is important to set the proper methodology, calculate several multiples and make plausibility checks (Koller, Goedhart and Wessels, 2010).
The most appropriate multiple to value companies is an enterprise value (EV) to EBITA. It is the most suitable ratio, because it reflects four value drivers: growth, return on invested capital, tax rate and cost of capital. In order to see the relationship, key driver formula for cash flow models is converted as follows:
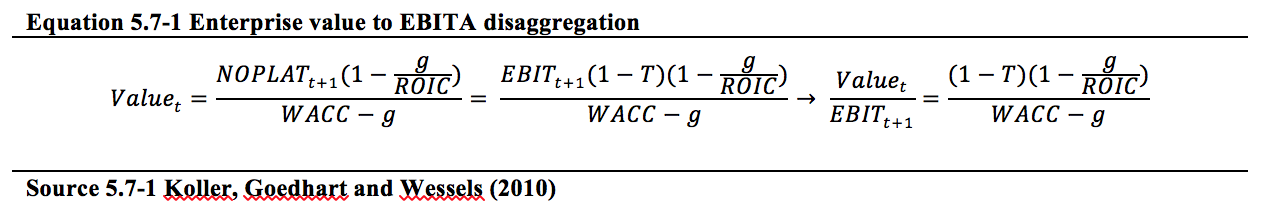
Pandora – financial and strategic evaluation – master thesis – investorship.uk
The multiple is superior to the most widely used price to earnings ratio (P/E), because it is not distorted by capital structure and non-operating gains and losses. It considers the operating activities and, therefore, reflects sustainable earnings in the next period. EV to EBITA is also a better multiple comparing with EV to EBIT, since amortization is often artificially created after acquisition. Companies with only organic growth have higher earnings, if earnings are calculated after amortization, since they are not allowed to recognize non-cash amortization[9] (Koller, Goedhart and Wessels, 2010).
EV to EBITDA is the closest alternative ratio. Since both depreciation and amortization are non-cash expenses and are created by accounting rules, they are often treated similarly. However, depreciation also marks the part of assets that was worn out and will be required to replace by the future capital expenditures. Since capital expenditures are recognized only as a balance sheet, depreciation is necessary to account for expenditure in the income statement. EBITDA multiple is superior in situations, when current depreciation is not a good estimator of future capital expenditures (Koller, Goedhart and Wessels, 2010).
Valuation might be done with backward or forward looking multiples. Unlike backward looking multiples, forward-looking multiples are (1) consistent with the principles of valuation – value equals the present value of future cash flow, not sunk costs and (2) forward-looking earnings are typically normalized, meaning they better reflect long-term cash flows by avoiding one-time past charges (Koller, Goedhart and Wessels, 2010). Kim and Ritter (1999) estimated that when valuation moves from historical earnings to multiples based on one and two years forecasts, average pricing error decreases from 55% to 44% and to 29% respectively.
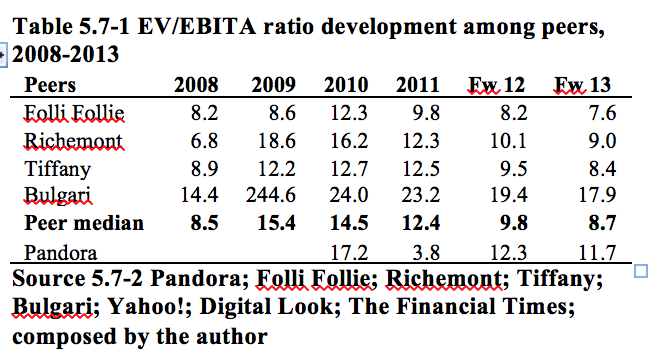
Pandora – financial and strategic evaluation – master thesis – investorship.uk
Historical peer EV to EBITA ratio development reveals extraordinary volatility. Peer median EV to EBITA ratio almost doubled from 2008 to 2009, but dropped down two subsequent years to 12.4 in 2011. Significant changes are also projected in the future. Forward (keeping enterprise value fixed at the end of 2011) EV/EBITA ratio is expected to drop to average 9.8 in 2012 and 8.7 in 2013.
Even more volatile was Pandora’s EV to EBITA ratio. Multiple of 17.2 in 2010 dropped to 3.8 in 2011 and considerable uncertainties wait in the future. It might seem that investors not only lost confidence in company’s perspectives, but also significantly underestimates company comparing to peer average (ratio 3.8 vs. 12.4). However, one and two years forward multiples shows that investors might even overvalue Pandora comparing with peer average – Pandora’s one year forward ratio of 12.3 is higher than peer average 9.8 and two year average ratio of 11.7 is higher than peer average of 8.7.
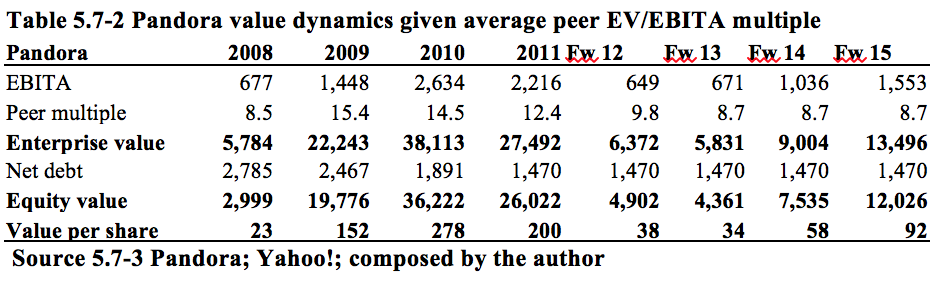
Pandora – financial and strategic evaluation – master thesis – investorship.uk
Value of Pandora is considerably low when peer multiple is applied to company’s EBITA level. Pandora’s value per share equals to 38 DKK, given one year forward peer median multiple and only 34 DKK, given two years forward peer multiple median. The valuation result is significantly below valuation of last three years, but is higher than valuation of 23 DKK/share in 2009.
One very obvious drawback of the multiple valuation method is ignorance of the long-term dynamics. In this case, valuation of Pandora with one or two year forward peer multiple is inaccurate, since EBITA is projected to decrease next year by -71%, remain almost flat in the second year (+3%) and recover in the third and fourth years with respectively +54% and +50% growth. Consequently, the value per share increases to 58 DKK and 92 DKK, when the same peer ratio is extended for extra two years. The latter result should be taken only as indication, since no real peer median for forward three and four years is available.
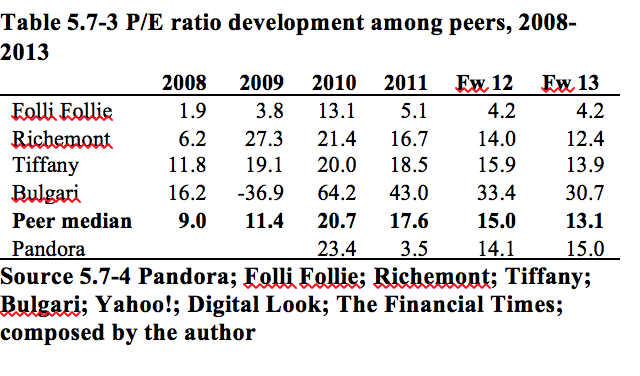
Valuation based on peer multiple average is unreliable, since both peer ratio and expectations for the company’s results are very inconsistent. Historical valuation ranges from 23 to 278 DKK/share and forward valuation ranges from 38 to 92 DKK/share.
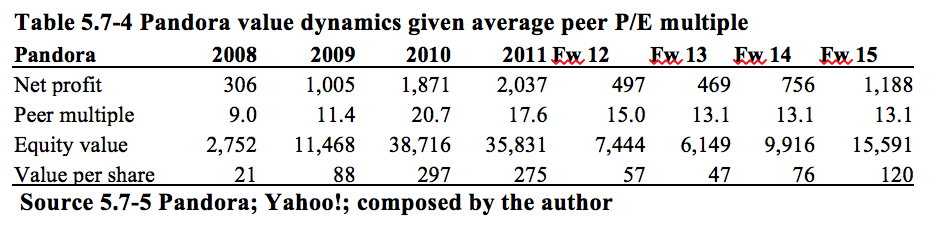
Pandora – financial and strategic evaluation – master thesis – investorship.uk
Widely used in practice valuation with EV to EBITDA multiple provides similar results that are portrayed in the appendix 6.9.
Valuation based on peer P/E multiple provides higher estimate mainly due to lower marginal tax rate. However, valuation with median peer multiple is again unreliable due to high historical volatility. Price to earning ratio swung from median of 9.0 in 2009 to 17.6 in 2011 and is projected at 15 one-year forward and 13.1 two-year forward. Pandora valuation with one-year forward median peer P/E ratio gives 57 DKK per share estimate and valuation with two years forward peer median ratio suggest 47 DKK/share estimate.
Valuation based on EV to revenues multiple is often considered when company experiences volatile earnings. Ratio decomposition shows that enterprise value to revenues is a function of previously analyzed ROIC, revenue growth and EBITA margin:
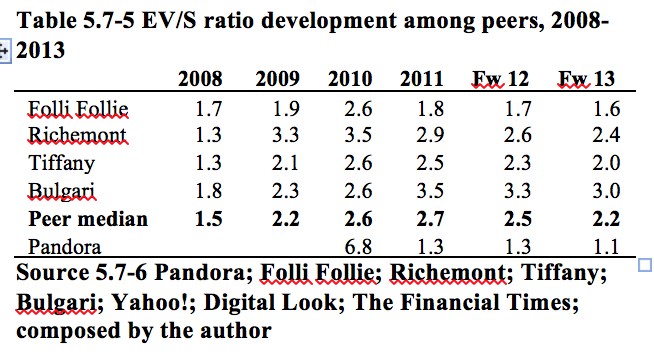
Pandora – financial and strategic evaluation – master thesis – investorship.uk

Pandora – financial and strategic evaluation – master thesis – investorship.uk
Further research by Koller, Goedhart and Wessels (2010) shows that there is a linear relationship between EBIT margin and revenue multiple. Authors estimate that operating margin explains 51% of EV/S ratio fluctuations in the regression of S&P 500 non-financial companies in December 2009 (see appendix 6.7). According to the regression, EV/S ratio changes by 0.09 (slope coefficient) with every 100bps change in EBIT margin and EV/S is 0.25 (intercept), when company is at break even in terms of operating profit. Pandora EV/S multiple would be 3.3 given the same coefficients and operating profit of 2011 and only 1.2 with forecasted operating profit of 2012.
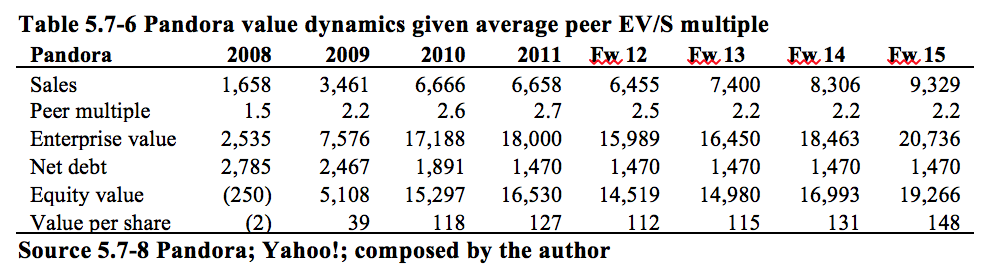
Pandora – financial and strategic evaluation – master thesis – investorship.uk
Valuation based on peer revenue multiple shows still high, but lower than earning volatility. Pandora value per share would swing from negative -2 DKK to positive 127 DKK, when median peer EV to revenues ratio changes from 1.5 in 2008 to 2.7 in 2011. What is more important, Pandora valuation decreases only to 112 DKK per share given one year forward peer revenue ratio and to 115 DKK per share given two year forward ratio.
Valuation based on book value is appropriate only to limited extent, since book value is determined by accounting rules and thus is heavily influenced by the original price paid for the asset and accounting adjustments made since that time. Comparison of price and book values is beneficial when (1) market sentiments overrun rational behavior and (2) companies had volatile earnings. Volatile nominator price caused peer average P/BV ratio to double from 1.5 in 2008 to 3.2 in 2011. One-year forward ratio is projected at 2.6 and two-year forward ratio at 2.2. Pandora value per share stands at 132 DKK, given the actual 2011 price to book value ratio and is 104 DKK and 92 DKK per share for respective one and two years forward peer averages (table in appendix 6.11).
Valuation based on price to earnings growth (PEG) is not possible, since negative growth of Pandora earnings is projected in the nearest future.
Another way to estimate the value of operations is to compare multiples of large share block exchanges, such as IPO, mergers and acquisitions. Pandora was valued at one-year forward[10] EV to EBITA ratio of 7.1 and EV to revenues ratio of 2.9, when Axcel acquired 60% stake of Pandora in March 2008. Company was listed at 210 DKK per share or one and a half year forward (based on 2011 results) EV to EBITA ratio 13.4 and EV to revenues of 4.5 in IPO.
Essential acquisition took place with one of the peers – Bulgari. LVMH offered for 50.4% stake 1.87 bEUR in March 2011, which suddenly lifted the trading price of Bulgari by +60%. Acquisition lifted Bulgari multiples highly above peer averages – two year forward EV/EBITA of 19.4 and two year forward EV/S of 3.3. These ratios are partly[11] reflected in the comparison with peers.
1.8.Valuation summary
Valuation chapter presents several ways how to estimate Pandora value. Overall, methods could be divided into two groups: (1) cash flow based models and (2) multiple based models. Cash flow models are favorable due to many aforementioned reasons. However, cash flow based valuation includes many subjective assumptions. Therefore, it is useful to make the plausibility check by aggregating and averaging target price estimates by other analysts.
According to Thomson/First Call database, Pandora stock’s median target price was 65 DKK per share as of 23 February 2012. Among the same ten brokers, the lowest target price was 54 DKK/share and the highest target price is 99 DKK/share (Yahoo!, 2012).
Lastly, the summary output of all valuation results is presented in the figure 6.7-1. Valuation interval ranges from 34 to 302 DKK per share. Median average of all methods provides 104 DKK per share estimate.
The average price and particularly the amplitude of all valuations provide the insight of how the valuations among investors and analysts are different, but do not provide the answer what is the fair price. The fair price, which is the ultimate goal of this thesis, equals to the value that is not based on short term current price volatilities or averages of many prices, but is based on probability weighted scenario discounted cash flow value driver model that incorporates all strategic and financial factors and reflects key value drivers: growth, return on invested capital and weighted average cost of capital.
Based on strategic and financial valuation, the estimated fair price of one share of Pandora as of 31 December 2011 on a stand-alone basis is 132 DKK

Pandora – financial and strategic evaluation – master thesis – investorship.uk
The fair price is by 144% higher than market price of 54 DKK / share on the same day. There are several reasons why market undervalues the share. The primary reason is anticipation of profit deterioration or even losses in the upcoming two years. Base case scenario projects negative cash flow of -1180 mDKK in 2012 and -423 mDKK in 2013. Two next years are critical and will show how company manages to overcome the crisis. Under pessimistic scenario the value of the company is projected to be 40 DKK per share, which is by -25% less than present market price. To sum up, market price shows aggregated expectations for the short period (one or two years) and discounted cash flow model provides long term value based on strategic and financial determinants.
The recommendation depends on the investment horizon. Investors are recommended to buy shares with long-term investment horizon and should hold shares or be aware of high volatilities in the short one to two years period.
2. Conclusion
This thesis was constructed to search for all the factors that affect Pandora’s value and consequently estimate the fair price. Pandora value is affected through three core value drivers: revenue growth (G), return on invested capital (ROIC) and cost of capital (WACC). Following conclusions enlist the strategic and financial factors, indicate the value driver and describe the implication (positive “+” or negative “–“).
Political environment. Instability of a new government formation in Thailand could lead to a breakup of the tax incentive agreement with Pandora. Populist expansionary fiscal policies might destabilize economy (ROIC–). Thailand’s new government plans to please businesses by cutting the corporate tax rate. Trading barriers are expected to soften around the world (ROIC+).
Economical environment. No major policy shifts are anticipated in the major silver and gold producers (ROIC+). US credit rating was downgraded, expecting economy and spending on consumer discretionary to be weak in the nearest period. UK budget deficit led to a seven-year fiscal tightening program, which includes tax rises and significant public spending cuts (G–). Resource rich Australia is expected to grow at an average +2.9% on a real GDP basis in 2012-2016 (G+). The indebtedness struggle of the euro area is projected to bring another mild recession (G–). Emerging countries, especially the Asia region, should grow at a higher rate comparing with developed countries (G+/-). Exchange rate volatility and euro weakness could adversely affect Pandora cash flows (ROIC–). FED and ECB keep the interest rates low. US and euro area inflations are projected to decrease to 2% after 2013 (WACC+). Weak economies and retreat of speculators should swing raw material prices down (ROIC+). Wages in Thailand are expected to increase rapidly in line with economic development and government policy to lift wages (ROIC–).
Social environment. Women at age 50-59 earn around 20% of total income and thus should be included in Pandora target customer definition. Women started to shift from luxury gold to affordable silver (G+). Costume jewelry has been taking some revenues from fine jewelry (G–). Precious metal jewelry should remain an important part of gifts. Emotional and well-designed jewelry gets popular and takes the share of statement jewelry. There is an increasing trend to mix jewelry materials and experiment. Ethical and fair trade jewelry tend to get more attention. The number of employed women has been increasing. The importance of social media has been rising (G+).
Technology enables to engrave variety of lifestyles and personalize the jewelry (G+). Jewelry consumers look for higher quality, variety of designs and innovative solutions that require new technologies (ROIC–). Organizations promoting environmentally friendly practices have more influence over the jewelry companies. The awareness for environmental issues has been rising among consumers. Green benchmark practices are getting more popular (ROIC–). Legal environment. “Conflict diamonds” and crime prevention programs require written policies and procedures from jewelry companies. Legal regulations of the disclosure get stricter (ROIC–). Copyright protections have not become easier (G–).
Cultures continue to mix and tastes tend to converge with migration, tourism and ethnic group appearances. There is a growing trend of individualization and spiritual jewelry (G+). Aesthetical minimalism has been growing in importance (G+). Store aesthetics have significant influences on purchasing behavior (ROIC, G-/+). Selling policies should be targeted depending on customer type: task, value, price oriented or discerning, abundance or experiential (G+). Jewelry sector belongs to consumer cyclical sectors that are dependent on seasonal periods (WACC–). Jewelry is increasingly linked up with other sectors. Jewelry companies could increase sales with better timing and speed (G+).
Competitive environment. Jewelry industry is extremely competitive with many players, low concentration and very low barriers to enter (ROIC, G–). Economies of scale are low, since product is not standardized and buying habits are varying (ROIC–). There are numerous raw material suppliers to choose (ROIC+). Differentiation is one of the most important methods to avoid the competition (ROIC, G+). The market of watches, clothes, handbags, accessories, perfume and cosmetics threatens to substitute jewelries, but is an opportunity to expand. Costume jewelry is the closest and most dangerous substitute and the most promising niche to expand (G–/+). Direct clients retailers have lower bargaining power comparing with Pandora (ROIC+). The prices of raw materials fluctuate in line with global demand and supply changes (ROIC+/-). Pandora has high bargaining power with providers of equipment, financial capital and labor due to low switching costs (ROIC, WACC+). Jewelry markets are filled by outstanding number of jewelry firms (ROIC–), but concentration of jewelry companies slowly increases (ROIC+). The decline in volume by local producers was partly offset by an increase in producer prices and higher imports (ROIC, G+).
Critical success factors are quality, design, warranty, comfort, price, assortment, brand, value, country of design, convenience and service. Different authors rank factors in different order because shoppers are ready to pay extra price on luxury goods only when all attributes are at the highest level (G+, ROIC–).
Internal strategic threshold resources: extensive portfolio of jewelry designs (G+), high network of retail shops (ROIC, G+), strong sponsor – private equity fund Axcel (WACC+), in-house trained diverse range of employees (ROIC+), large part of Pandora assets is intellectual capital (G+). Threshold competences: standardized production processes enables to manage solid resources (ROIC+). Unique resources: popular product charm (G+), state-of-the-art production facilities (ROIC+), skilled and inexpensive production team in Thailand (ROIC+), in-house designers from Denmark (G+), revolving credit facility (WACC+), highly valued brand (G+). Core competences: extensive manufacturing experience, abilities to scale the craftsmanship (ROIC+), abilities to enter new markets (G+), strong financial consolidation and control functions (ROIC+), a win-win retail proposal (G+).
Primary activities. Warehousing and logistics team is responsible for both inbound and outbound logistics. Operations are “polished” with a combination of long manufacturing experience, state-of-art plants, founder’s goldsmith skills and reputation, cost efficiency in Thailand. Warehouse facilities are located near production site in Thailand (ROIC+). Products are distributed through a central warehouse in Denmark (ROIC–). Marketing and sales consolidation is done at the cost of entrepreneurial character (G+). Pandora has no full control over the service standard to end-customers (G–). In order to ensure that products are displayed in accordance to Pandora’s retail guidance company makes regular check up visits (G+).
Supporting activities. Pandora has a special department for procurement activities (ROIC+). Pandora has a particular focus on product design, R&D and process development. Product portfolio is regularly updated with an introduction of approximately 200 new designs per year. There is a fast track design process for designing specific products or making specific modifications at the request of sales team (G+). Company has long product development cycle (ROIC–). There is a lack of contemporary designers for jewelries not related with charms and charm concept (G–). Pandora initiated the process of being certified according to OHSAS 18001: Occupational Health and Safety. Pandora undergoes the process of implementing a more comprehensive group-wide monitoring system (ROIC+).
Value chain. Pandora misses the opportunity of collecting value added from retail operations, which typically represent 59% of all value created (G–). Pandora demands higher prices comparing with other wholesalers (G+).
Strategy clock. Differentiation strategy enables to demand higher prices (G+), but by going away from hybrid strategy Pandora looses possibilities to sell large volumes and has difficulties entering new markets (G–). Pandora takes advantage of imperfect mobility of resources and capabilities, such as intangible brand, image and reputation assets and creates numerous requirements to its retail partners. Pandora could benefit by building multiple biases of differentiation and establishing several brands to capture low and high price sensitive customers (G+). Pandora might benefit by establishing joint research and emerging activities, joint marketing function and trade association to promote jewelry technical specifications and safety standards (Revenues, ROIC+). Pandora benefits from collaboration with retailers by increasing cost efficiency, quality and reliability (ROIC+).
Ansoff matrix. Diversification strategy leads to economies of scope, higher market power and dispersion of the risk (Revenues, ROIC, WACC+). Pandora pursues forward diversification strategy by acquiring distribution activities and increasing presence in vertical chain (Revenues, ROIC+).
BCG matrix. Pandora benefits from two ‘star’ business units: product charms and US market. Company plans to focus effort on ‘question mark’ segments: Asia and watches (G+), but it will require significant investments (ROIC–). Pandora presence in UK, Germany, other Europe and Australia has potential to remain ‘cash cows’, if revenues stabilize (G+). Strategy for Pandora ‘dogs’, other jewelry products, needs to be reshuffled with additional investments (ROIC–).
Organic growth mode should dominate due to scalability of design and manufacturing activities, possibilities to spread investment over the time and minimization of disruption to current activities (G, ROIC, WACC+). Pandora might benefit from co-specialization when entering new markets and non-jewelry products (G+).
Revenue growth. Company reached the point when customers are not ready to pay for affordable jewelry more and should lower current prices to keep volume stable (G, ROIC–). The overall neutral result in 2011 was sustained only due to new markets, particularly Asia Pacific region. New markets and particularly emerging countries should remain being the most important contributors to growth (G+). There is a threat that company will not be able to stabilize the revenues from mature markets (G–). Pandora’s presence in Asia is significantly lower comparing with peers. Company is expected to continue shifting from third part to direct distribution model. One of the most significant components of revenue growth was a change of sale channels from unbranded to branded store. Even though the product diversification has been increasing, the pace is very slow and dependency on charms is still risky (G+). Comparing the overall revenue dynamics with peers, Pandora seems to have quite an individual path, uncorrelated with market movements (G–/+). Comparing with peers, Pandora is a very homogenous (reliance on one product) company (G–, ROIC+).
Pandora has superior profitability comparing with peers (ROIC+), but it is not sustainable in the long-term (ROIC–). Company highly benefited from hedging policies on raw materials in the past (ROIC+), but should incur losses in the nearest future (ROIC–). Comparing with peers Pandora pays lower salaries to production employees (ROIC+), but competitive salaries to management team (G+). Gross margins are driven by centralized state-of-art production facilities, extensive expertise in production and relatively small presence in other than charms product categories. Superior operating profit margins are achieved due to lower than peer average SG&A expenses (ROIC+). Pandora maintains the advantage of high margins by spending significant amounts on marketing (ROIC–, G+).
Pandora has been employing relatively insignificant tangible invested capital and significant intangible capital. Company managed invested capital efficiently, when counting all invested capital, and above average, when counting only tangible invested capital. Pandora used more operating leasing than buying the PP&E, but still below peer average. Even though Pandora’s working capital efficiency has been decreasing over last three years, it is still much above the peer average. Pandora chooses efficiency of its current assets over liquidity and ability to meet short-term creditor’s demand (ROIC+). Pandora is underleveraged comparing with peers in terms of both D/E and D/EBITDA ratios (ROIC–).
Pandora generated twice more free cash flow comparing with peers, when investment in goodwill, acquired intangibles and capitalized operating leases are excluded (ROIC+), but negative free cash flow after investment in all assets (ROIC–). Pandora’s ROIC is considerably higher than peers (ROIC+), but has been gradually decreasing and approaching the industry average (ROIC–). Pandora’s performance was superior to peer level in all ROIC components except premium over book value (ROIC+).
Capitalization on product offering should help to maintain the future revenue base, as the popularity of the main product charms gradually fades out. Growth rate of charms should converge with the average market growth – lower rates in developed countries and higher pace in emerging countries, where popularity of products are expected to come with a time lag. Charms should dominate, but only with 56% weight in total sales by 2020. Old customer will return to add new charms on old bracelets, increasing the ratio of charms to charm bracelets revenues. Rings contribution in total revenues should more than double, converging with the global fine jewelry structure. Only 4.5% of total sales are expected to come from other than jewelry products by 2020. Pandora branded sales will account for 90% of total sales by 2020. While the revenue pyramid is expected to change in shape and size, the number of stores distribution pyramid is projected to become only slightly steeper. The proportion of unbranded POS is forecasted to decrease to 42% in 2020. The growth rates to new markets are expected to slow down. Revenues from regions are expected to vary from 2012-20 CAGR +4.7% in Americas and 4.8% in Europe to 24.6% in Asia Pacific.
Pandora is expected to loose superior gross margins starting from 2012. Gross margin is expected to drop to 49% due to raw material price change and price of production cut. Gross margin is expected to decline further in 2013 and revitalize in 2014. SG&A expenses are expected to decline and normalize at 36%, which is by 600bps better than peer average in 2011. EBTDA margin deterioration is expected mainly due to commodity price fluctuations and inability to adjust operating costs adequately. By 2020 Pandora is expected to have EBITDA margin of 21%, which is slightly above the three-year peer average of 20%. NOPLAT is expected to decline by -68% in 2012 and gradually recover from 2013 to 2019.
Invested capital is expected to increase from 7.8 bDKK in 2011 to 16.5 bDKK in 2020. Inventory level is projected to continue rising, only at much slower rate, up to 2020. Operating working capital ratio[12] is projected to upsurge in 2012, reach the maximum in 2013, gradually decrease till 2016 and again start rising up to 2020. PP&E to revenue ratio is expected to rise to 15.2% by 2020.
Free cash flow projections are considerably negative for the next two years, breakeven is expected in 2014 and strong recovery in 2015. Revenue growth is expected to slow down to average 3.6% in the second explicit period and finally land at 3.0% rate in the steady growth period. Adjusted EBITA margin is expected to reach 20% in the perpetuity period. Invested capital ratios are expected to worsen and converge, but do not fully reach peer average. No more tax benefits are projected in the steady growth period. Finally, ROIC is expected to converge to 12%, which is above overall average 10%, but equal to peer average.
Pandora’s weighted average cost of capital equals to 8.72%, given cost of equity estimation of 9.8%, after tax cost of debt 2.59% and capital structure of 85% equity and 15% debt. Risk free rate is projected at 1.68%, market risk premium 4.5%, beta 1.36, liquidity premium of zero, company-specific premium of 2% and interest margin of 177bps.
Pandora’s annual terminal growth rate is 3%, given 1.5% volume growth and 1.5% price increases, constant profit margin and operating cash tax rate of 31%. It is expected that long-term return on new invested capital (RONIC) will vary around 12%.
Pandora’s value per share is 115 DKK given discounted cash flow value driver and economic profit models, 108 DKK given perpetuity free cash flow model, 104 DKK given exit multiple model and 102 DKK given NOPLAT convergence model.
Sensitivity analysis reveals that value declines by -22%, when WACC increases by 100bps; value drops by -14%, when revenue growth rate is cut by -100bps and valuation decreases by -15%, when return on invested capital declines by -100bps. Valuation is less sensitive to terminal value factors – terminal value growth (-4% with -100bps cut) and RONIC (-2% with -100bps cut). The value decreases by -2%, when tax rate is lifted by +100bps and value decreases by -2%, when target debt to value ratio changes from 15% to 10%. Finally, Pandora value drops by -43%, when all three key value drivers change aversely change by 100bps.
Pandora’s value per share drops to 40 DKK under pessimistic scenario with discounted cash flow value driver model, but value rises to 302 DKK per share under optimistic scenario. Expected value rises to 132 DKK per share given 15% likelihood of pessimistic, 15% of optimistic and 70% of base case scenarios.
Pandora’s value per share equals to 34 DKK, given two years forward peer median EBITA multiple, 47 DKK given net profit multiple, 115 DKK given revenue multiple and 92 DKK per share book value multiple.
Valuation interval ranges from 34 to 302 DKK per share with median value of 104 DKK. This average and particularly the amplitude reveal different valuation approaches, but does not answer what the fair price is.
The fair price, which is the ultimate goal of this thesis, is based on probability weighted scenario discounted cash flow value driver model that incorporates all strategic and financial factors and reflects key value drivers: growth, return on invested capital and weighted average cost of capital.
Based on strategic and financial valuation, the estimated fair price of one share of Pandora as of 31 December 2011 on a stand-alone basis is 132 DKK
The fair price is by 144% higher than market price of 54 DKK / share on the same day. The recommendation depends on the investment horizon. Investors are recommended to buy shares with long-term investment horizon and should hold shares or be aware of high volatilities in the short one to two years period.
3. Perspectives
The ultimate goal of this thesis is to estimate the value based on most likely development scenario. However, company could change the path and, most important, improve the valuation by altering the strategy. Management already initiated on a thorough assessment of the issues within the business and finalized a strategic review using external consultants during Q4 2011. The assessment confirmed that although the fundamentals of Pandora’s strategy are sound, the execution had faltered in a number of areas. Author of this master thesis agree conceptually, but would like to add several perspectives that would increase the valuation:
· Pandora should stop mechanically hedging the raw material prices, because that would disable the benefits from the upcoming decrease in raw material prices. Pandora benefited from hedging when raw material prices have been increasing, but opposite is expected when market price drops. Base case scenario is based on the fact that hedged prices will incorporate the raw material price decrease with a time lag. Pandora should hedge prices only when the hedging incorporates the fundamental forecasts;
· Pandora should enter retailing operations to capture more than half of value created in the vertical jewelry chain. The closer the activity is to the ultimate buyer, the more value is created. According to CBI (2008), retail represents 59%, distribution 14% and manufacturing 14% of all value created;
· Pandora should enter costume (or design) jewelry segment, which has higher growth rates comparing with the fine jewelry segment. Company would have more synergies with this and any other jewelry categories rather than non-jewelries watches or sunglasses. Design jewelry also fits to Pandora target affordable segment;
· Entrance to non-jewelry segments should incorporate “create & combine” concept, otherwise products are stands apart from the brand and are endangered to be unpopular. The unsuccessful development of non-jewelries category in Tiffany shows that Pandora should put more emphasis on incorporating the products in the assortment. Pandora is doing well outsourcing the production, but it could better collaborate with watchmakers, researchers and innovators on design solutions;
· Pandora should set lower prices for emerging markets to fit into the affordable jewelry category. Company could reduce the prices by offering cheaper collection. Company should leverage its strength of offering affordable price products, but collecting high revenues with returning customers;
· Pandora should increase the diversity the design team to capture innovative solutions and upcoming trends. Company could collaborate with (1) designers from many countries to apprehend different styles (2) professionals from other fields, particularly researchers and marketers to find innovative solutions and (3) customers to reverse the design model and see what customers might value the most;
· Other suggestions are provided in the appendix 8.
4. List of literature
Aiello, G. et al., 2009. An international perspective on luxury brand and country of-origin effect. Journal of Brand Management, Vol. 16
Alexander, G. and Chervany, N., 1980. On the Estimation and Stability of Beta. Journal of Financial and Quantitative Analysis 15
Anglia Ruskin University, 2012. Harvard System of Referencing Guide, [online] 13 February. Available at: <http://libweb.anglia.ac.uk/referencing/harvard.htm> [Accessed on 6 March 2012]
Arnold, M., 2010. Pandora shares leap on Copenhagen debut. Financial Times, [online] 5 October. Available at: <http://www.ft.com/intl/cms/s/0/99d13512-d078-11df-afe1-00144feabdc0.html#axzz1lp1nMgd7> [Accessed on 6 March 2012]
Axcel, 2011a. Annual review 2010, [online] 11 May. Available at: <http://uk.axcel.uat.fonqi.com/media/annual-review.aspx> [Accessed on 6 March 2012]
Axcel, 2011b. Announcement from Axcel on behalf of Prometheus Invest. This announcement is regarding company announcement No.26 from Pandora, [press release] 18 April. Available at: <http://uk.axcel.uat.fonqi.com/media/64855/press_release_prometheus__3_.pdf> [Accessed 6 March 2012]
Axcel, 2011c. Axcel posts investment profit of DKK 11.5 billion, [press release] 11 April. Available at: <http://uk.axcel.uat.fonqi.com/media/87764/pm_aar2010_eng.pdf> [Accessed 6 March 2012]
Axcel, 2011d. Axcel raises Denmark’s biggest-ever fund, [press release] 12 July. Available at: <http://uk.axcel.uat.fonqi.com/media/98369/pressemeddelelse_-_axcel_iv-en.pdf> [Accessed 6 March 2012]
Axcel, n.d.a. Fund: Axcel III, [online]. Available at: <http://uk.axcel.uat.fonqi.com/funds/axcel-iii.aspx> [Accessed on 24 February 2012]
Axcel, n.d.b. How we work, [online]. Available at: <http://uk.axcel.uat.fonqi.com/about-axcel/how-we-work.aspx> [Accessed on 24 February 2012]
Bates, R., 2010. The Ethics of Gold, JCK magazine, [online] March issue. Available at: <http://www.jckonline.com/article/450340-The_Ethics_of_Gold.php> [Accessed on 24 February 2012]
Bentow, D., 2010a. Kapitalfond scorer 14 mia. kr. på Pandoras børsnotering, Berlingske Media, [online] 5 October. Available at: <http://www.business.dk/fashion-design/kapitalfond-scorer-14-mia.-kr.-paa-pandoras-boersnotering> [Accessed on 24 February 2012]
Bentow, D., 2010b. Dansk kapitalfond scorer største gevinst i 10 år, Berlingske Media, [online] 24 August. Available at: <http://www.business.dk/finans/dansk-kapitalfond-scorer-stoerste-gevinst-i-10-aar> [Accessed on 24 February 2012]
Bjerrum, V.D., 2008. Guldklump i trygge hænder, [online] 6 October. Available at: <http://www.erhvervsbladet.dk/virksomheder/guldklump-i-trygge-haender> [Accessed on 24 February 2012]
Black, F., Jensen, M. and Scholes, M., 1972. The Capital Asset Pricing Model: Some Empirical Tests, Studies in Theory of Capital Markets, Praeger Pubslishers Inc.
Blume, M., 1975. Betas and Their Regression Tendencies, The Journal of Finance, Vol. 30, No 30, pp. 785-795
BofA Merrill Lynch Global Research, 2011. Global Fund Managers Survey, [online] January. Available at: < http://www.ml.com/index.asp?id=7695_8137_47928> [Accessed on 24 February 2012]
Brealey, R., Meyers, 2003. Principles of Corporate Finance, 7th edition, The McGraw-Hill
Bulgari, 2009. Bulgari group consolidated financial statement as of 31 December 2008 [online]. Available at: <http://ir.bulgari.com/presentations/> [Accessed on 20 December 2011]
Bulgari, 2010. Bulgari group consolidated financial statement as of 31 December 2009 [online]. Available at: <http://ir.bulgari.com/presentations/> [Accessed on 20 December 2011]
Bulgari, 2011a. Bulgari group consolidated financial statement as of 31 December 2010 [online]. Available at: <http://ir.bulgari.com/presentations/> [Accessed on 20 December 2011]
Bulgari, 2011b. Bulgari group H1 2011 results [online]. Available at: <http://ir.bulgari.com/presentations/> [Accessed on 20 December 2011]
Routledge, R., n.d. Chebyshev’s inequality, Encyclopedia Britannica [online]. Available at: <http://www.britannica.com/EBchecked/topic/108218/Chebyshevs-inequality> [Accessed on 24 February 2012]
Berlingske Media, 2010. Pandora køber Kasi-Jesper ud for 1 mia ved børsnotering, [online] 8 September. Available at: <http://www.business.dk/oekonomi/pandora-koeber-kasi-jesper-ud-for-1-mia-ved-boersnotering> [Accessed on 24 February 2012]
Bloomberg, n.d. Denmark Government Bonds 10 Year Note Generic Bid Yield [online]. Available at: <http://www.bloomberg.com/quote/GDGB10YR:IND> [Accessed on 6 March 2012]
CBI, 2008. The jewelry market in the EU, Centre for the Promotion of Imports from developing countries (CBI), an agency of Netherlands Ministry of Foreign Affairs [online]. Available at: <http://www.cbi.eu/> [Accessed on 24 February 2012]
CBI, 2011a. Trends and segments for silver jewelry, Centre for the Promotion of Imports from developing countries (CBI), an agency of Netherlands Ministry of Foreign Affairs [online]. Available at: <http://www.cbi.eu/> [Accessed on 24 February 2012]
CBI, 2011b. Silver jewelry in the United Kingdom, Centre for the Promotion of Imports from developing countries (CBI), an agency of Netherlands Ministry of Foreign Affairs [online]. Available at: <http://www.cbi.eu/> [Accessed on 24 February 2012]
CBI, 2011c. Silver jewelry in Germany, Centre for the Promotion of Imports from developing countries (CBI), an agency of Netherlands Ministry of Foreign Affairs [online]. Available at: <http://www.cbi.eu/> [Accessed on 24 February 2012]
CBI, 2011d. Trends and segments for silver jewelry, Centre for the Promotion of Imports from developing countries (CBI), an agency of Netherlands Ministry of Foreign Affairs, [online] 30 November. Available at: <http://www.cbi.eu/> [Accessed on 24 February 2012]
Coinnews Media Group, 2012. Historical Inflation rates 1912-2011, US inflation calculator [online]. Available at: <http://www.usinflationcalculator.com/inflation/historical-inflation-rates/> [Accessed on 6 March 2012]
Damodaran, A., 2011. Applied Corporate Finance, 3rd edition, John Willey & Sons, Inc.
Damodaran, A., 2012a. Ratings, Spreads and Interest Coverage Ratios, Damodaran Online, [online] January. Available at <http://pages.stern.nyu.edu/~adamodar/New_Home_Page/datafile/ratings.htm> [Accessed on 6 March 2012]
Damodaran, A., 2012b. Levered and Unlevered betas by industry, Damodaran Online, [online] January. Available at <http://www.stern.nyu.edu/~adamodar/pc/datasets/betaGlobal.xls> [Accessed on 6 March 2012]
Digital Look, 2012. Company result forecasts [online]. Available at
<http://www.digitallook.com/> [Accessed on 6 March 2012]
D’Aveni, R., 1995. Hypercompetitive rivalries: competing in highly dynamic environments, Free Press
Henderson, B.D., 1979. Henderson on Corporate Strategy. Abt Books.
HM Revenue & Customs, 2012. Personal income statistics 2009-10, United Kingdom [online] 29 February. Available at: <http://www.hmrc.gov.uk/stats/personal_incomes/statistics-release-note.pdf> [Accessed on 6 March 2012]
H.R. 2832, Generalized System of Preferences Act, 2011. Democratic Policy and Communication Center, [legislative bulletin] 19 September. Available at: <http://dpc.senate.gov/docs/lb-112-1-25.pdf> [Accessed on 6 March 2012]
Dhein, C., 2008. Reduce Environmental Impact With Green Bench Practices, JKC Magazine, [online] November issue. Available at: <http://www.jckonline.com/article/291731-Reduce_Environmental_Impact_With_Green_Bench_Practices.php> [Accessed on 6 March 2012]
Dimson, E., Marsh, P., Staunton, M., 2011. Credit Suisse Global Investment Returns
EIU, 2011a. Country report Thailand, Economic Intelligence Unit (EIU) of The Economist Group [online] September issue. Available at: < http://www.eiu.com/> [Accessed on 6 March 2012]
EIU, 2011b. Key changes since July 8th 2011, Global Forecasting Service, The Economist Intelligence Unit, [online] 17 August. Available at: < http://www.eiu.com/> [Accessed on 6 March 2012]
EIU, 2011c. Country report Australia, Economic Intelligence Unit (EIU) of The Economist Group [online] September issue. Available at: < http://www.eiu.com/> [Accessed on 6 March 2012]
EIU, 2011d. Country report UK, Economic Intelligence Unit (EIU) of The Economist Group [online] September issue. Available at: < http://www.eiu.com/> [Accessed on 6 March 2012]
EIU, 2011e. Country report Germany, Economic Intelligence Unit (EIU) of The Economist Group [online] October issue. Available at: < http://www.eiu.com/> [Accessed on 6 March 2012]
EIU, 2012a. Country report Thailand, Economic Intelligence Unit (EIU) of The Economist Group [online] February issue. Available at: < http://www.eiu.com/> [Accessed on 6 March 2012]
EIU, 2012b. Global Forecasting Service, The Economist Intelligence Unit [online]. Available at: < http://www.eiu.com/> [Accessed on 6 March 2012]
ECB, 2011. Key ECB interest rates, European Central Bank, [online] December. Available at: <http://www.ecb.int/stats/monetary/rates/html/index.en.html> [Accessed on 6 March 2012]
ECB, European Commission, Eurostat, 2012. European Commission (Eurostat) and European Central Bank calculations based on Eurostat data [online]. Available at: <http://sdw.ecb.europa.eu/> [Accessed on 6 March 2012]
Euromonitor International, 2012. Passport, Euromonitor International’s global market analysis software platform [online]. Available at: <http://www.portal.euromonitor.com/portal/default.aspx> [Accessed on 6 March 2012]
Faulkner, D. and Bowman, C., 1995. The Essence of Competitive Strategy. Prentice Hall
Folli Follie, 2009. FF group Annual Report 2008 [online]. Available at: <http://www.follifolliegroup.com/default.asp?pid=36&la=1&cid=1> [Accessed on 6 March 2012]
Folli Follie, 2010. FF group Annual Report 2009 [online]. Available at: <http://www.follifolliegroup.com/default.asp?pid=36&la=1&cid=1> [Accessed on 6 March 2012]
Folli Follie, 2011a. FF group Annual Report 2010 [online]. Available at: <http://www.follifolliegroup.com/default.asp?pid=36&la=1&cid=1> [Accessed on 6 March 2012]
Folli Follie, 2011b. FF group Three months 2011 Financial results, [online]. Available at: < http://www.follifolliegroup.com/default.asp?pid=73&la=1&cid=1> [Accessed on 6 March 2012]
Folli Follie, 2011c. FF group Six months 2011 Financial results, [online]. Available at: < http://www.follifolliegroup.com/default.asp?pid=73&la=1&cid=1> [Accessed on 6 March 2012]
Folli Follie, 2011d. FF group Nine months 2011 Financial results, [online]. Available at: < http://www.follifolliegroup.com/default.asp?pid=73&la=1&cid=1> [Accessed on 6 March 2012]
Freeman, R.E., 1984. Strategic Management: A Stakeholder Approach, Pitman
Global-rates.com, 2012. FED Federal Funds Rate, American central bank’s interest rate [online]. Available at: <http://www.global-rates.com/interest-rates/central-banks/central-bank-america/fed-interest-rate.aspx> [Accessed on 6 March 2012]
Hall, A.O., Hansen, J.C., 2010. Et armbånd forandrede Per Enevoldsens liv og sendte milliarder af kroner ind på hans konto, Berlingske Media, [online] 26 August. Available at: <http://www.business.dk/diverse/han-skabte-pandora> [Accessed on 6 March 2012]
Hawksworth, J., 2006. The world in 2050, Implication of global growth for carbon emissions and climate change policy, PriceWaterHouseCoopers researches, [online] September issue. Available at: <www.pwc.com/gx/en/world-2050/pdf/world2050carbon.pdf> [Accessed on 6 March 2012]
Jamal, A. and Goode, M., 2001. Consumer’s product evaluation: A study of the primary evaluative criteria in the precious jewelry market in the UK. Journal of Consumer Behaviour, Vol. 1, 2, pp. 140-155
JKC Magazine, 1999. How technology revolutionized the jewelry industry, [online] September issue. Available at: <http://www.jckonline.com/1999/09/01/how-technology-revolutionized-jewelry-industry> [Accessed on 6 March 2012]
JKC Magazine, 2004. Jewelry sales counter is ‘front line’ in legal issues, [online] 6 June. Available at: <http://www.jckonline.com/2004/06/06/jewelry-sales-counter-front-line-legal-issues> [Accessed on 6 March 2012]
Johnson, G., Scholes, K., Whittington, R., 2008. Exploring Corporate Strategy, 8th edition. Essex: Pearson Education Limited, Financial Times Prentice Hall
Kim, M. and Ritter, J. R., 1999. Valuing IPOs. Journal of Financial Economics 53, No. 3, pp. 409–437
Koller, T., Goedhart, M., Wessels, D., 2010. Valuation, measuring and managing the value of companies, University edition, 5th edition, McKinsey & Company. Hoboken: John Willey & Sons, Inc.
Laffont, J.J., Martinmort, D., 1997. The theory of incentives: the principal agent model. Princeton University Press
Lim, S.C., Mann, S.C. and Mihov, V.T., 2003. Market Evaluation of Off-Balance Sheet Financing: You Can Run but You Can’t Hide, 1 December. EFMA 2004 Basel Meetings Paper
Malone, T., 2011. Six Types of Jewelry Shoppers, JKC Magazine, [online] 16 September. Available at: <http://www.jckonline.com/blogs/memo-to-merchandisers/2011/09/16/six-types-jewelry-shoppers> [Accessed on 6 March 2012]
Mendelow, A., 1991. Proceedings of the Second International Conference on Information Systems. Cambridge
Mortensen, S.W., 2011. Stifter køber Pandora-aktier for 53 mio. kr., Borsen, [online] 29 August. Available at: <http://borsen.dk/nyheder/investor/artikel/1/213918/stifter_koeber_pandora-aktier_for_53_mio_kr.html> [Accessed on 6 March 2012]
MSCI, 2012. MSCI World index [online]. Available at: <http://www.msci.com/products/indices/size/standard/performance.html> [Accessed on 6 March 2012]
Nicholson, C., n.d. The Pandora phenomenon, The Jewellery Outlook, [online]. Available at: <http://www.jewelleryoutlook.com/index.php?option=com_content&view=article&id=207> [Accessed on 6 March 2012]
Oxford University, n.d. PESTEL analysis of the macro-environment, Oxford University Press [online]. Available at: <http://www.oup.com/uk/orc/bin/9780199296378/01student/additional/page_12.htm> [Accessed on 6 March 2012]
Pandora and Axcel, 2008. Axcel acquires stake in jewelry company Pandora, [press release] 10 March. Available at: <http://admin.pandora-jewelry.com/CA_EN/About%20Pandora/Press%20releases/~/media/Country%20Specific/United%20States/Press%20Releases/Pressrelease%20Axcel%20acquires%20stake%20in%20Pandora.ashx> [Accessed on 6 March 2012]
Pandora, 2009. Annual report 2008 [online]. Available at: <http://investor.en.pandora.net/annuals.cfm> [Accessed on 6 March 2012]
Pandora, 2010a. IPO prospectus, [online] 20 September. Available at: <http://investor.en.pandora.net/prospectus.cfm> [Accessed on 6 March 2012]
Pandora, 2010b. Pandora prices its initial public offering at dkk 210 per share, announcement No. 1, [press release] 5 October. Available at: <https://newsclient.omxgroup.com/cdsPublic/viewDisclosure.action?disclosureId=420211&lang=en> [Accessed on 6 March 2012]
Pandora, 2010c. Exercise in full of the over-allotment option in connection with Pandora a/s initial public offering. Total initial public offering size increased to dkk 11,359 million, announcement No. 5, [press release] 8 October. Available at: <https://newsclient.omxgroup.com/cdsPublic/viewDisclosure.action?disclosureId=420709&lang=en> [Accessed on 6 March 2012]
Pandora, 2010d. Annual report 2009 [online]. Available at: <http://investor.en.pandora.net/annuals.cfm> [Accessed on 6 March 2012]
Pandora, 2011a. Update on financial expectations for 2011 – CEO departs, announcement No. 30, [press release] 2 August. Available at:
<https://newsclient.omxgroup.com/cdsPublic/viewDisclosure.action?disclosureId=463973&lang=en> [Accessed on 6 March 2012]
Pandora, 2011b. Interim report of the second quarter of 2011, [company webcast] 2 August. Available at: <http://storm.zoomvisionmamato.com/player/pandora/objects/s70wyfrj> [Accessed on 6 March 2012]
Pandora, 2011c. Company announcement regarding Pandora A/S – major shareholders announcement, announcement no. 41, 8 September
Pandora 2011d. Pandora appoints new CEO, announcement No. 45, [press release] 19 December. Available at: <https://newsclient.omxgroup.com/cdsPublic/viewDisclosure.action?disclosureId=482899&lang=en> [Accessed on 6 March 2012]
Pandora, 2011e. Annual report 2010, [online] 15 March. Available at:
<http://investor.en.pandora.net/annuals.cfm> [Accessed on 6 March 2012]
Pandora, 2011f. Annual Magazine 2011 [online]. Available at: <http://www.pandoragroup.com/en/About-Pandora/~/media/Files/Corporate/PDF/Pandora_2011_Annual_Magazine_web.ashx> [Accessed on 6 March 2012]
Pandora, 2011g. SEB Enskilda Nordic Seminar, [online] 12 January. Available at: <http://investor.en.pandora.net/presentations.cfm> [Accessed on 6 March 2012]
Pandora, 2011h. Interim report for Q1 2011, announcement No. 27, [press release] 19 May. Available at: < http://investor.en.pandora.net/results.cfm> [Accessed on 6 March 2012]
Pandora, 2011j. Interim report for Q2 2011, announcement No. 31, [press release] 2 August. Available at: < http://investor.en.pandora.net/results.cfm> [Accessed on 6 March 2012]
Pandora, 2011k. Interim report for Q3 2011, announcement No. 44, [press release] 22 November. Available at: < http://investor.en.pandora.net/results.cfm> [Accessed on 6 March 2012]
Pandora, 2012a. Annual report 2011, [online] 21 February. Available at:
http://investor.en.pandora.net/annuals.cfm> [Accessed on 6 March 2012]
Pandora, 2012b. Markets worldwide [online]. Available at:
<http://www.pandoragroup.com/Markets> [Accessed on 6 March 2012]
Pandora, 2012c. Company presentation Q4 2011, [press release] 21 February. Available at: <http://investor.en.pandora.net/results.cfm> [Accessed on 6 March 2012]
Pitt-Watson, D., Davies, S. and Lukomnik, J., 2006. The New Capitalists, How citizen investors are reshaping the corporate agenda. Boston: Harvard Business School Press
Porter, M.E., 1998. Competitive strategy, Techniques for analyzing industries and competitors. The Free Press
Richemont, 2010. Richemont Annual report and accounts 2009 [online]. Available at: <http://www.richemont.com/investor-relations/reports.html> [Accessed on 6 March 2012]
Richemont, 2011. Richemont Annual report and accounts 2010 [online]. Available at: <http://www.richemont.com/investor-relations/reports.html> [Accessed on 6 March 2012]
Richemont, 2012a. Richemont Annual report and accounts 2011 [online]. Available at: <http://www.richemont.com/investor-relations/reports.html> [Accessed on 6 March 2012]
Richemont, 2012b. Richemont Condensed Consolidated Interim Financial Statements 30 September 2011 [online]. Available at: <http://www.richemont.com/investor-relations/reports.html> [Accessed on 6 March 2012]
Sanguanpiyapan, T., Jasper, C., 2010. Consumer insights into luxury goods: Why they shop where they do in a jewelry shopping setting. Journal of Retailing and Consumer Services 17, pp. 152–16
Silwa, C., 2011. Modern Minimalism in Apparel & Jewelry, JKC Magazine, [online] 24 February. Available at:
<http://www.jckonline.com/blogs/jewels-on-jewels/2011/02/24/modern-minimalism-apparel-jewelry> [Accessed on 6 March 2012]
Standards & Poor’s, 2011. United States of America Long-Term Rating Lowered To ‘AA+’ Due To Political Risks, Rising Debt Burden; Outlook Negative, [online] 5 August. Available at: <http://www.standardandpoors.com/ratings/articles/en/us/?assetID=1245316529563> [Accessed on 6 March 2012]
Tiffany, 2009. Tiffany & Co annual report for the year ended January 31, 2009 [online]. Available at: <http://investor.tiffany.com/annuals.cfm> [Accessed on 6 March 2012]
Tiffany, 2010. Tiffany & Co annual report for the year ended January 31, 2010 [online]. Available at: <http://investor.tiffany.com/annuals.cfm> [Accessed on 6 March 2012]
Tiffany, 2011a. Tiffany & Co annual report for the year ended January 31, 2011 [online]. Available at: <http://investor.tiffany.com/annuals.cfm> [Accessed on 6 March 2012]
Tiffany, 2011b. Tiffany reports strong first quarter results; sales and earnings better than expected; increases full year earnings outlook [online]. Available at: <http://investor.tiffany.com/annuals.cfm> [Accessed on 6 March 2012]
Tiffany, 2011c. Tiffany reports substantially higher-than-expected sales and earnings growth in its second quarter [online]. Available at: <http://investor.tiffany.com/annuals.cfm> [Accessed on 6 March 2012]
Tiffany, 2011d. Tiffany reports strong third quarter results [online]. Available at: <http://investor.tiffany.com/annuals.cfm> [Accessed on 6 March 2012]
Tiffany, 2012. Tiffany reports fourth quarter and full year results, 2011 [online]. Available at: <http://investor.tiffany.com/results.cfm> [Accessed on 6 March 2012]
The Financial Times, 2012. Financial forecasts [online]. Available at: <http://ft.com/marketsdata> [Accessed on 6 March 2012]
The London Bullion Market Association, 2012. Gold and silver prices, data reproduced by permission of The London Silver Market Fixing Ltd. and The London Gold Market Fixing Ltd [online]. Available at: < http://www.lbma.org.uk/> [Accessed on 6 March 2012]
The Silver Institute, 2011. World Silver Survey 2011 [online]. Available at: <http://www.nma.org/pdf/g_silver_producers.pdf> [Accessed on 6 March 2012]
Trading NRG, 2011a. As expected the ECB raised its interest rate to 1.5% – July 7, [online] 7 July. Available at: <http://www.tradingnrg.com/as-expected-the-ecb-raised-its-interest-rate-to-1-5-july-7> [Accessed on 6 March 2012]
Trading NRG, 2011b. ECB Cut Interest Rate to 1.00% – December 8, [online] 8 December. Available at: <http://www.tradingnrg.com/euro-to-us-dollar-ecb-cut-euro-interest-rate-to-1-december-82011/> [Accessed on 6 March 2012]
Trading NRG, 2012. ECB Left Interest Rate Unchanged at 1.00% – March 8, [online] 8 March. Available at: <http://www.tradingnrg.com/euro-to-us-dollar-ecb-left-euro-interest-rate-at-1-march-8-2012> [Accessed on 6 March 2012]
Wienberg, C., 2011. Pandora Loses More Than Two-Thirds of Value as Charm Maker Cuts Forecast, [online] 2 August. Available at: <www.bloomberg.com/news/2011-08-02/pandora-drops-as-charm-maker-cuts-forecast.html> [Accessed on 6 March 2012]
Yahoo!, 2012. Pandora historical share prices, Yahoo! Finance [online]. Available at: <http://finance.yahoo.com/q/hp?s=PNDORA.CO+Historical+Prices> [Accessed on 6 March 2012]
Yearbook 2011, Credit Suisse Research Institute and London Business School, [online] February issue. Available at: <https://infocus.credit-suisse.com/app/_customtags/download_tracker.cfm?dom=infocus.credit-suisse.com&doc=/data/_product_documents/_shop/300847/credit_suisse_global_investment_yearbook_2011.pdf&ts=20110326172226> [Accessed on 6 March 2012]
5. Appendices
[1] Three economists derived the model in mid-1960s: W.Sharpe, J.Lintner and J.Treynor.
[2] Formula: and assumption of long run ROE = 13.5% and long run growth in real GDP = 3.5%.
[3] If no normal distribution is assumed, Chebyshev’s inequality (Routledge, n.d.) suggests that three quarters of observations are spread within two standard deviations
[4] Interest coverage ratio = adjusted EBITA / interest expenses
[5]A base case annual world GDP growth forecast of 3.2% from 2004 to 2050 is made by Hawksworth (2006)
[6]
[7] Continuity value = FCF (1 + g) / (WACC – g)
[8] Continuity value = NOPLAT (1 + g) / WACC
[9] In certain situations, if the amortization is recorded as a result of investments (such as software) and not acquisitions, then amortization must be treated as depreciation.
[10] One-year forward ratio is not based on expectations; it is based on retrospective 2009 results. It is assumed that Axcel expected one-year results to be those that actually came in 2009.
[11] Partly, because median avoids inclusion of extreme values, in this case Bulgari
[12] Operating working capital ratio = Operating working capital / Revenues

Leave a Reply